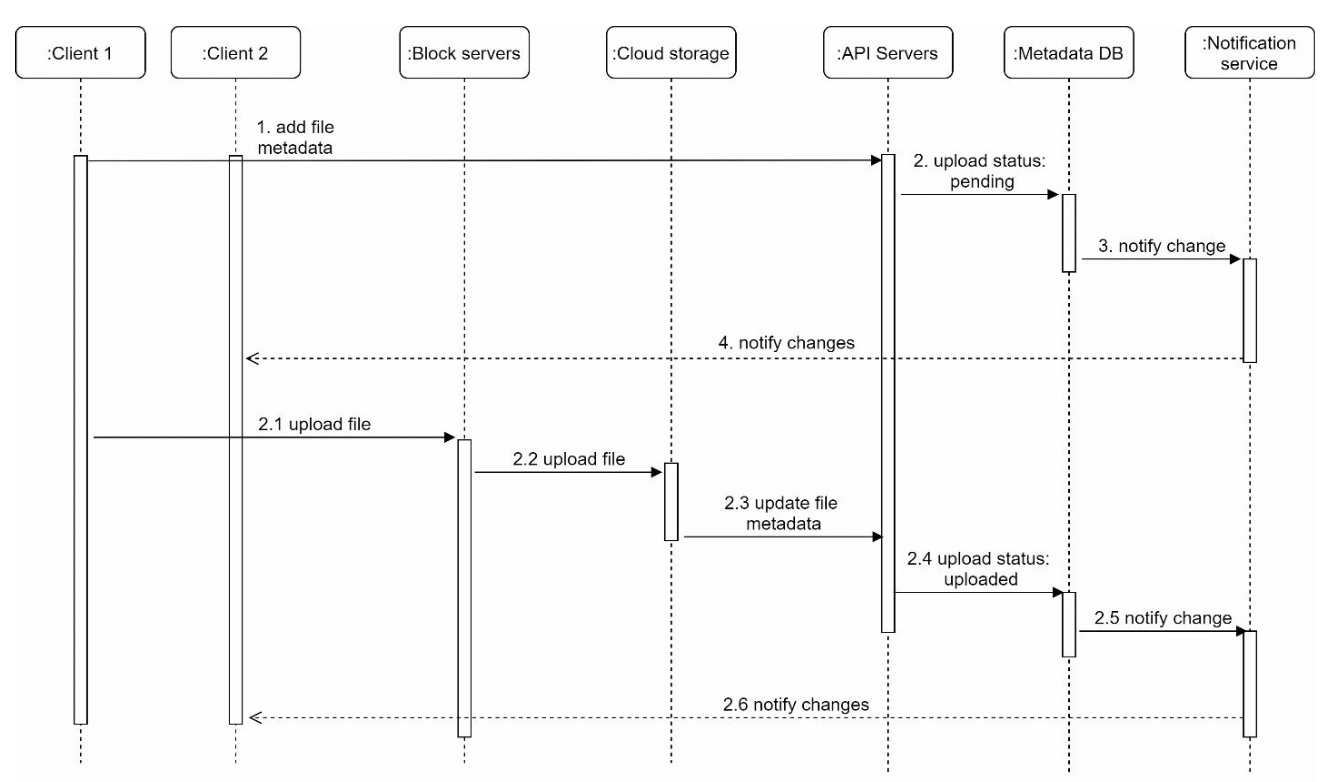
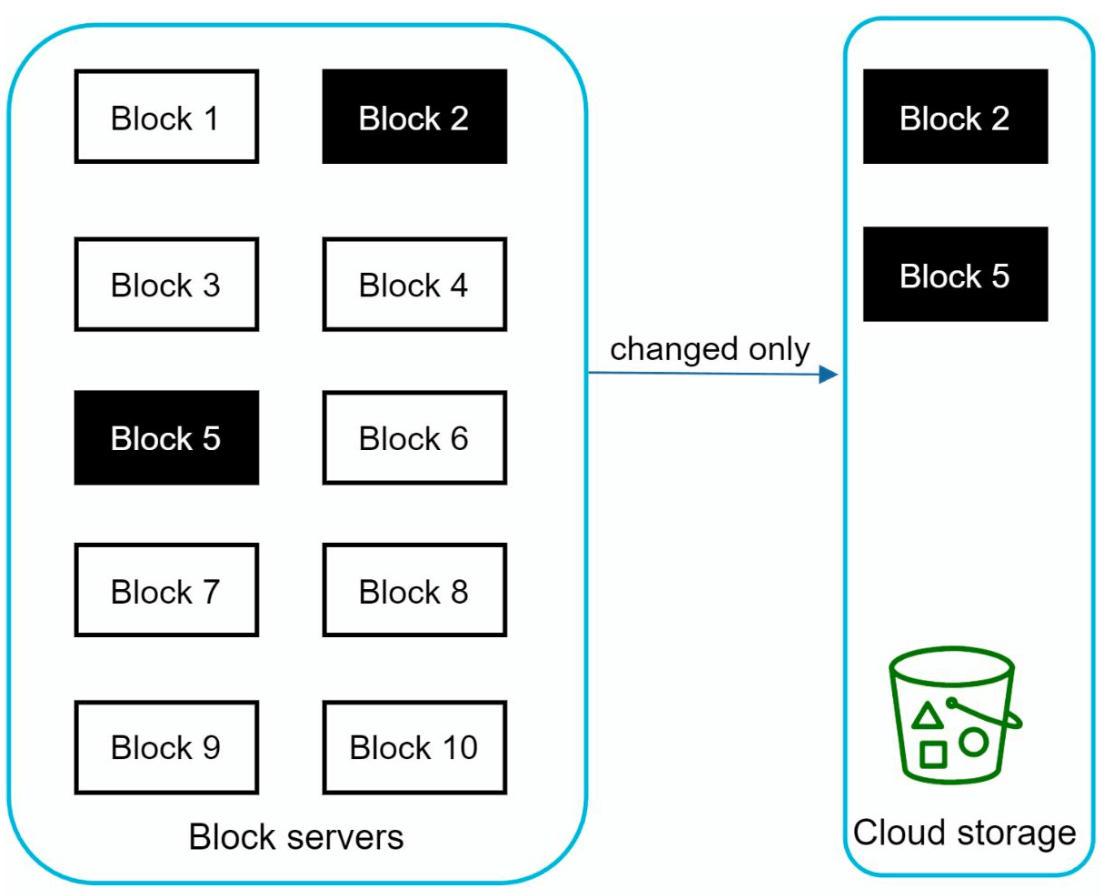
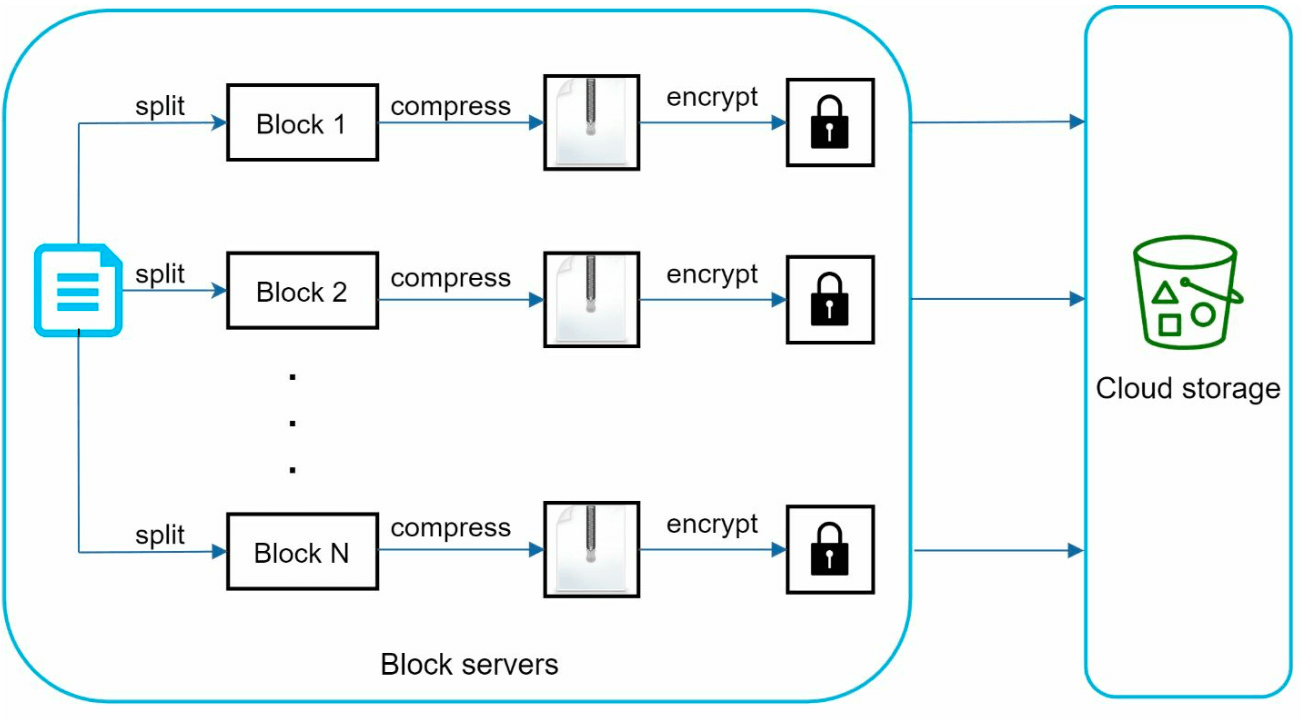
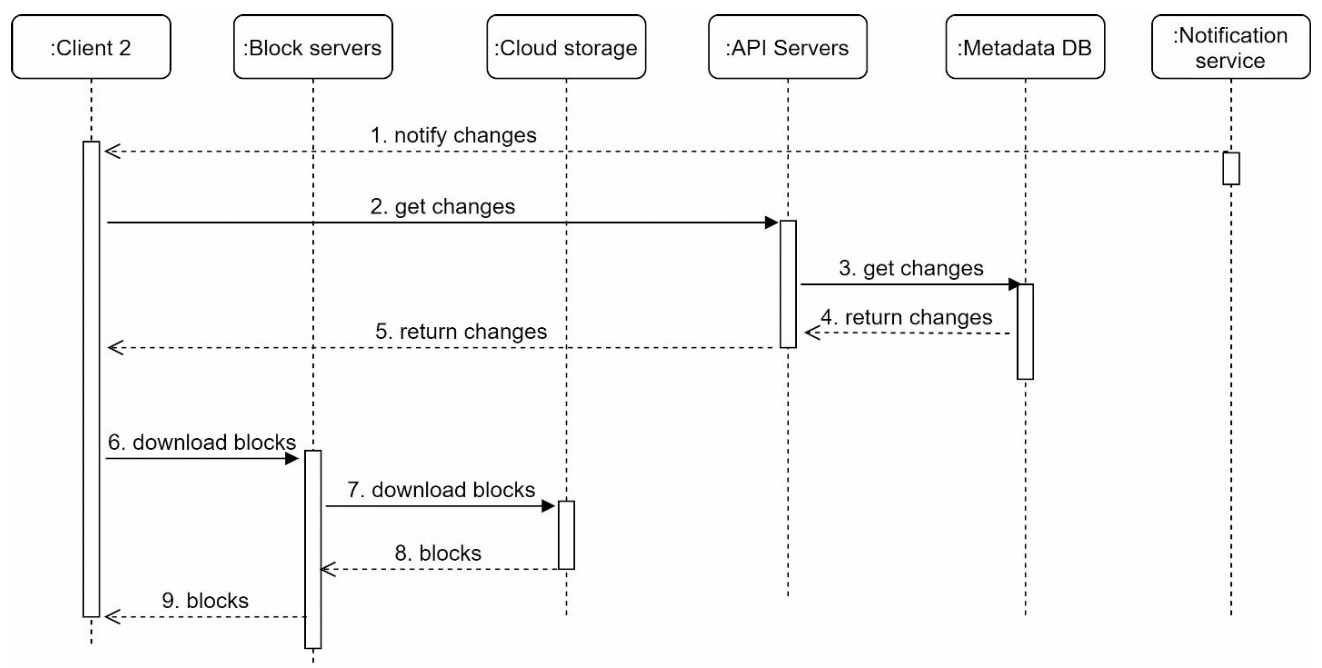
Scaling a system to support millions of users is a complex, iterative journey requiring refinement and optimization. This chapter outlines how to begin with a single server setup and scale the architecture step by step to handle millions of users.
Section 1: Single Server Setup
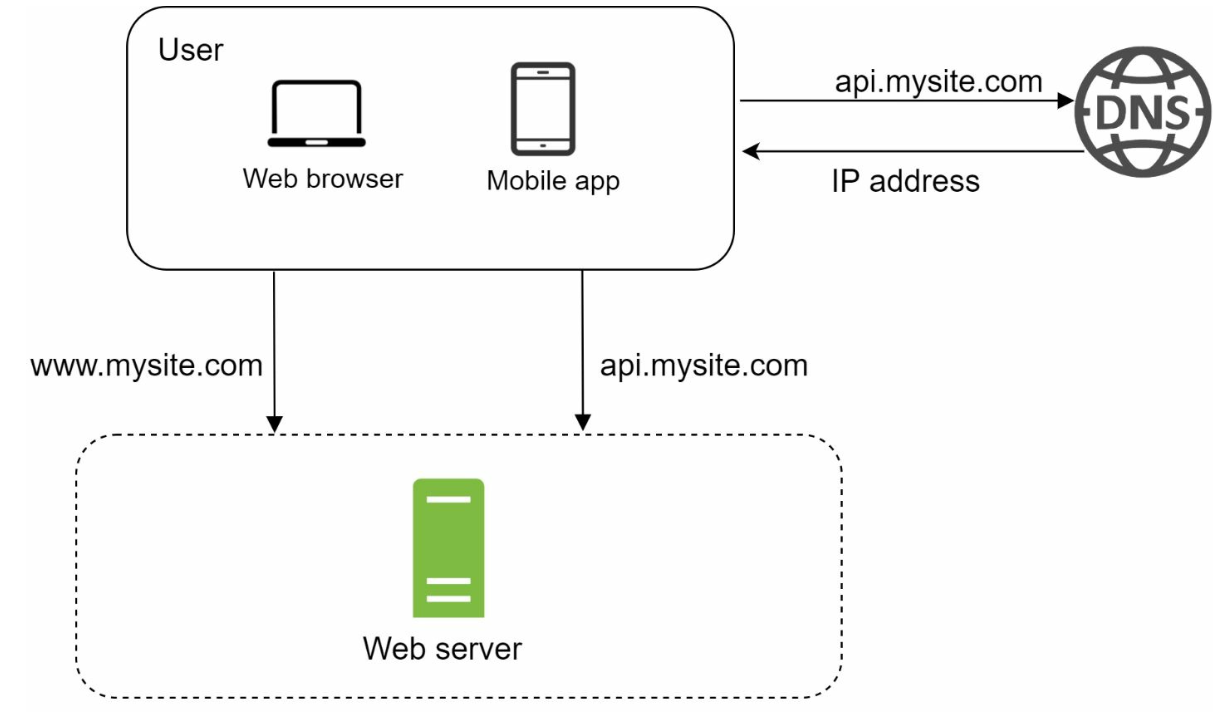
Initially, all components (web app, database, cache) run on a single server.
Redrawn · diagram-design
Request Flow
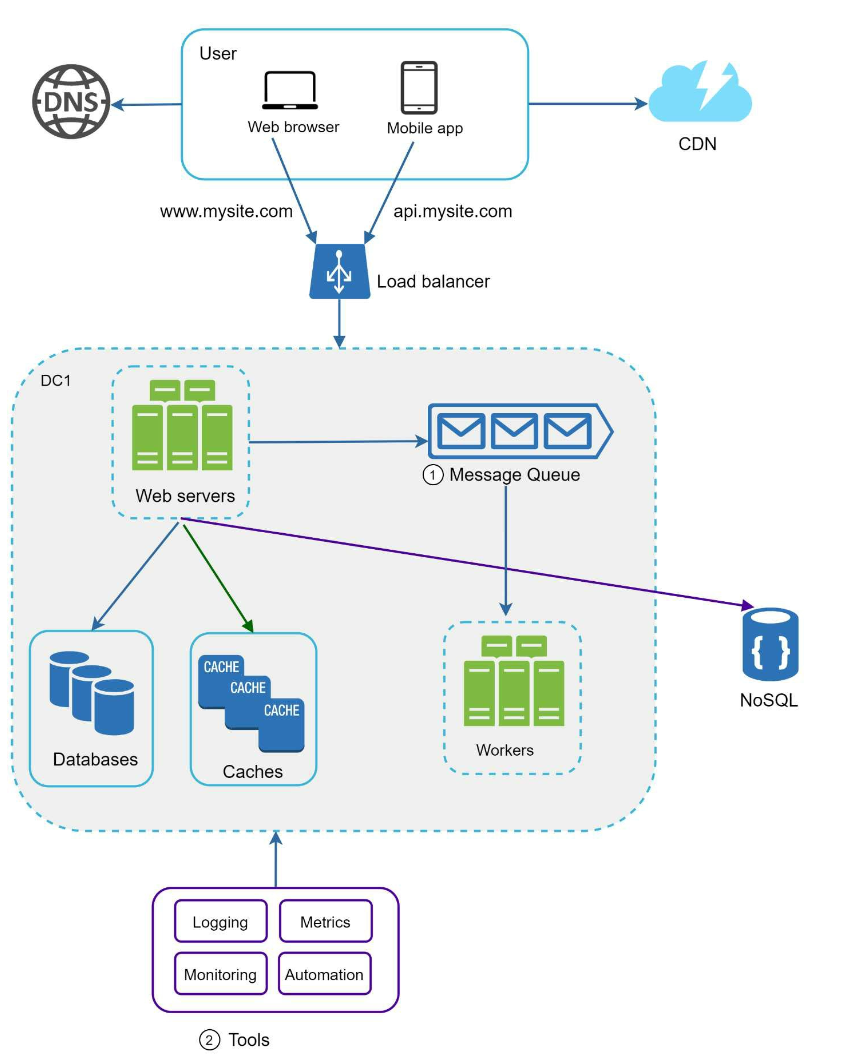
Users access the application via domain names (e.g., api.mysite.com), resolved to IP addresses using DNS.
IP address of the web-server is returned to the browser or mobile app.
HTTP requests are sent to the web server, which returns HTML or JSON responses.
Traffic Sources
Web Applications: Use server-side languages (e.g., Python, Java) for business logic and client-side languages (e.g., JavaScript, HTML) for presentation.
Mobile Applications: Communicate with the web server using HTTP and JSON for lightweight data exchange.
Section 2: Database Separation
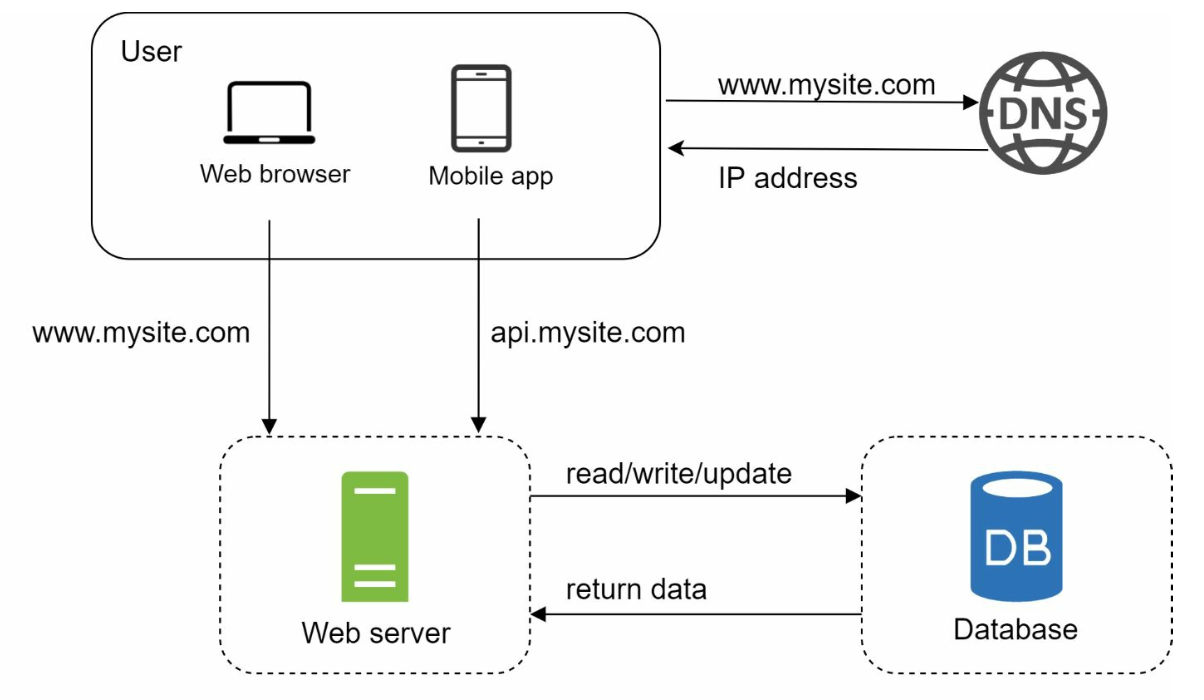
As the user base grows, the database is moved to a dedicated server to allow independent scaling of web and database tiers.
Redrawn · diagram-design
Database Choices
Relational Databases (SQL): Structured data stored in tables. Examples: MySQL, PostgreSQL.
Non-Relational Databases (NoSQL): Suitable for unstructured data or low-latency requirements. Categories include:
Key-Value Stores
Graph Databases
Column Stores
Document Stores
Non-relational databases might be the right choice if:
application requires super-low latency.
data is unstructured, or there is no relational data.
only need to serialize and deserialize data (JSON, XML, YAML, etc.).
need to store a massive amount of data.
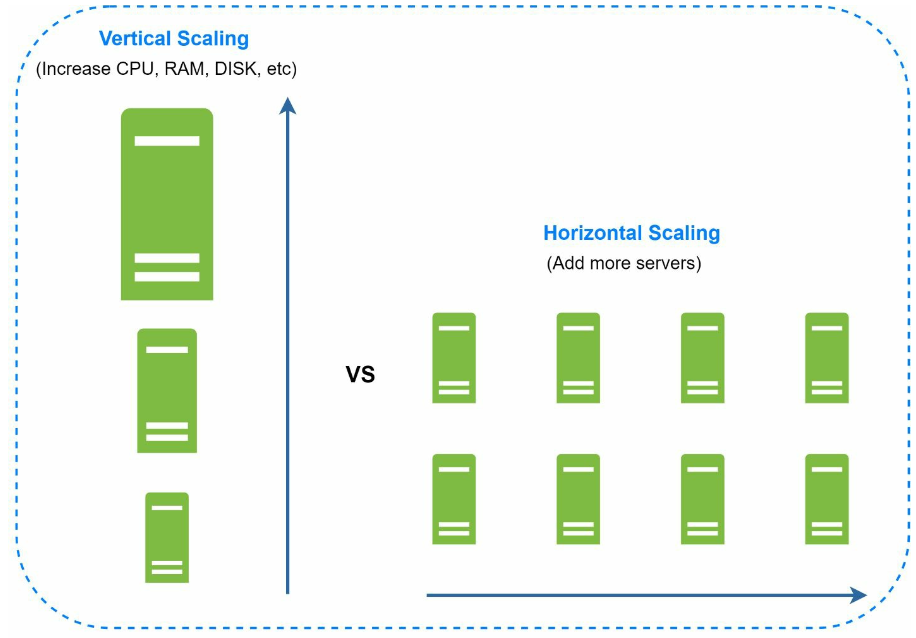
Section 3: Vertical vs Horizontal Scaling
Vertical Scaling
Adds more resources (CPU, RAM) to existing servers.
Limited by hardware constraints and lacks redundancy.
Horizontal Scaling
Adds more servers to the pool, making it more suitable for large-scale systems.
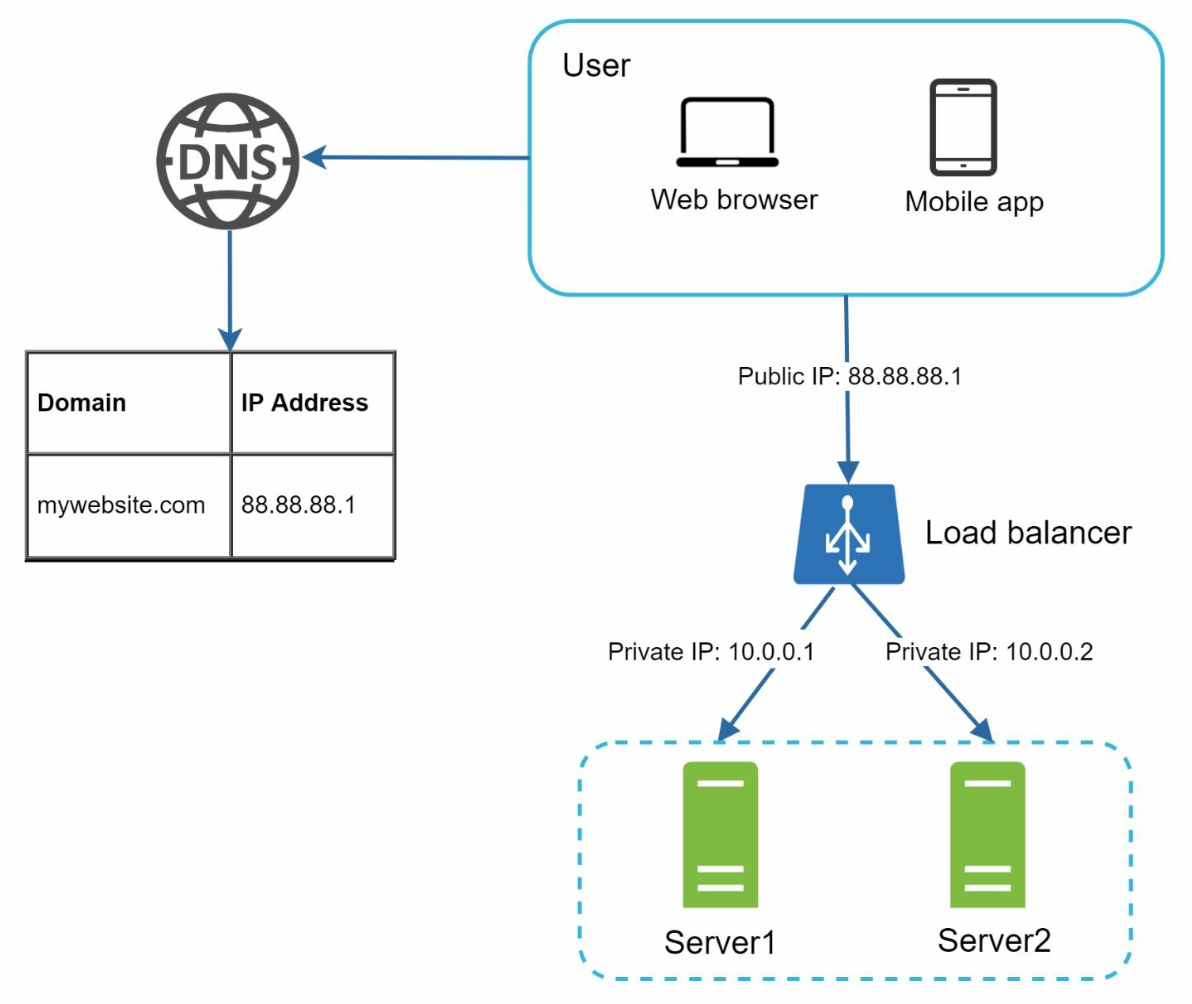
A load balancer is used to handle the request routing between the servers.
Section 4: Load Balancer
Redrawn · diagram-design
A load balancer distributes traffic among multiple servers. Benefits include:
Redundancy: If a server goes offline, traffic is rerouted.
If server 1 goes offline, all the traffic will be routed to server 2.
Scalability: Easily add servers to handle traffic spikes.
If the website traffic grows rapidly, subsequent servers can be added to handle the additional traffic.
Section 5: Database Replication
Redrawn · diagram-design
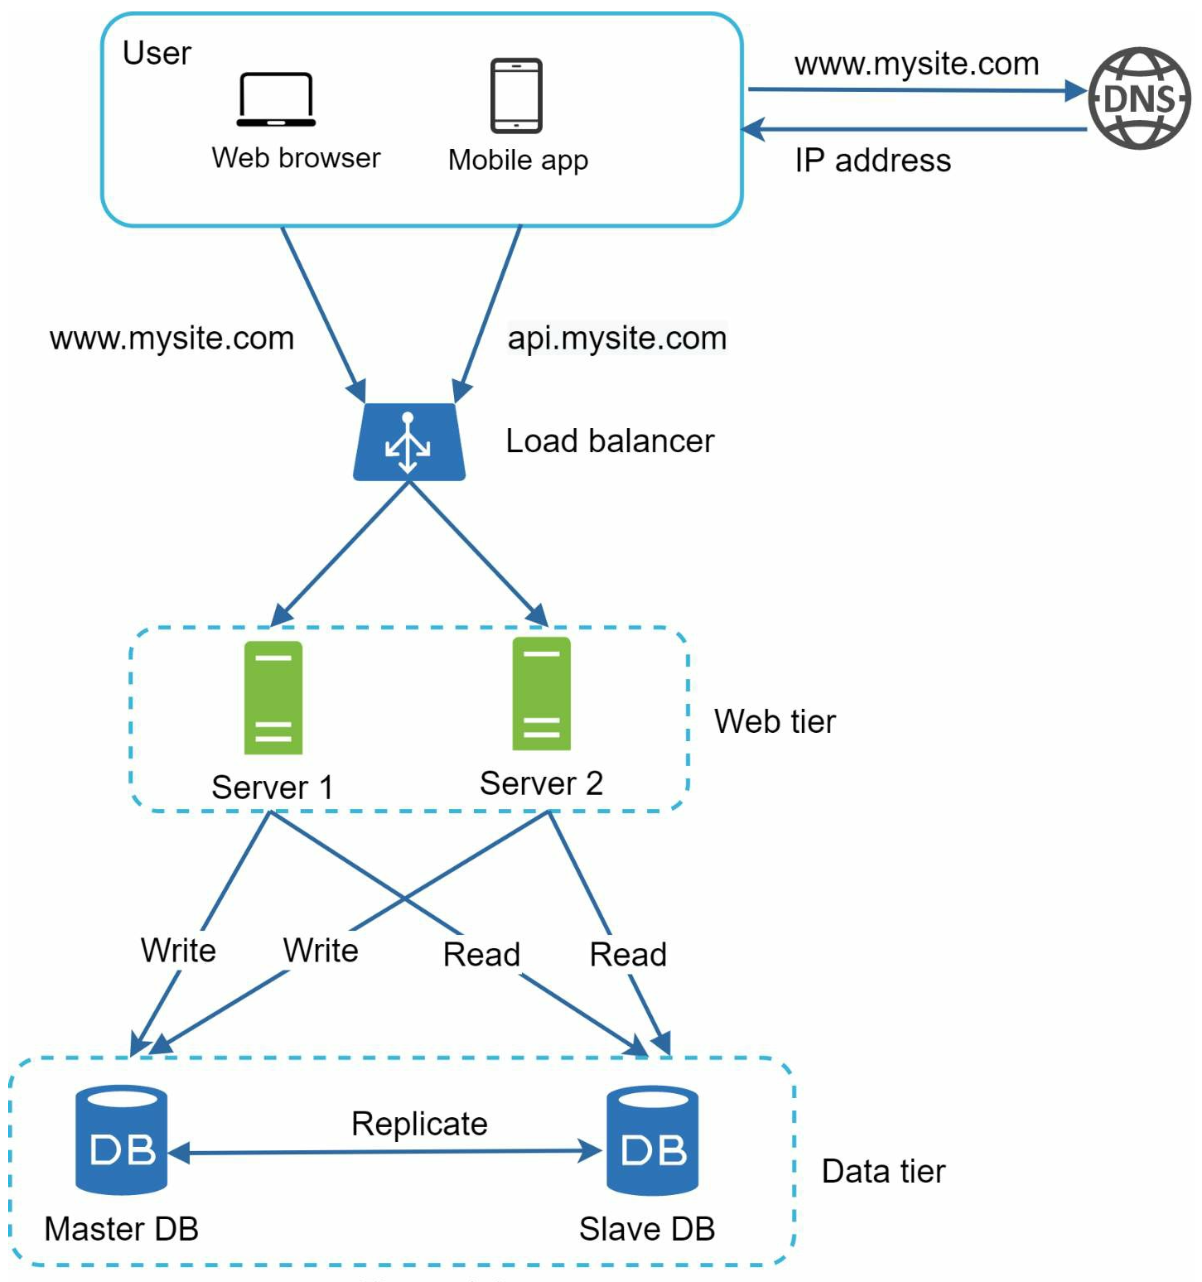
Master-Slave Model
Master Database: Handles write operations.
All the data-modifying commands like insert, delete, or update must be sent to the master database.
Slave Databases: Handle read operations, improving performance and reliability.
Since the ratio of reads to writes is higher in most applications; thus, the number of slave
databases in a system is usually larger than the number of master databases.
Benefits
Improved performance through parallel read operations.
High availability and data reliability through redundancy.
Failure Handling
If only one slave database is available and it goes offline, read operations will be directed
to the master database temporarily.
In case multiple slave databases are available, read operations are
redirected to other healthy slave databases and a new server will replace the old one.
If the master database goes offline, a slave database will be promoted to be the new
master.
In production system the chosen slave database might not be up to date, hence data needs to be updated by running data
recovery scripts (methods like multi-masters and circular replication could help).
Section 6: Caching
A cache stores frequently accessed data in memory to reduce database load. The cache tier is a temporary data store layer, much faster than the database.
Redrawn · diagram-design
Caching considerations
Use case: Consider using cache when data is read frequently but modified infrequently.
Expiration Policies: Once cached data is expired, it is removed from the cache. When there is no expiration policy, cached
data will be stored in the memory permanently.
Consistency: This means keeping the data store and the cache in sync. Inconsistency
can happen because data-modifying operations on the data store and cache are not in a single transaction.
Mitigating failures: A single cache server represents a potential single point of failure, multiple
cache servers across different data centers are recommended to avoid SPOF.
Eviction Policies:: Once the cache is full, items need to be evicted to free up memory. LRU is the most popular cache eviction policy.
Section 7: Content Delivery Network (CDN)
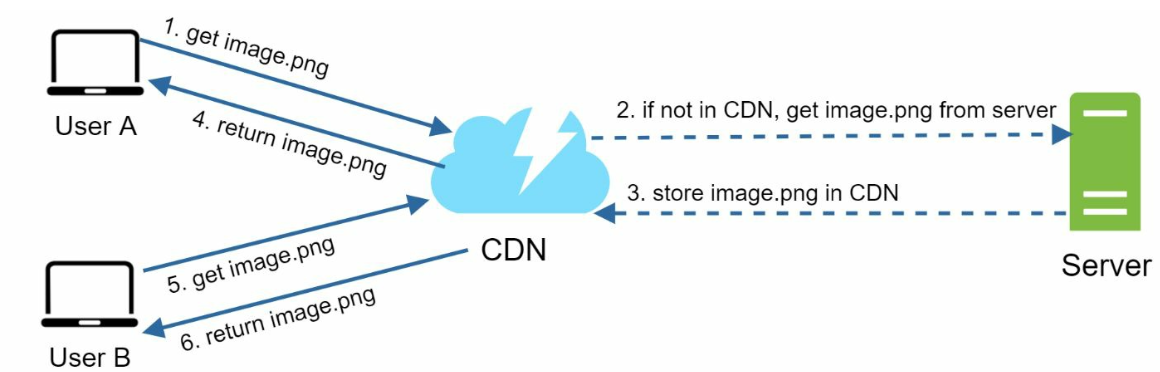
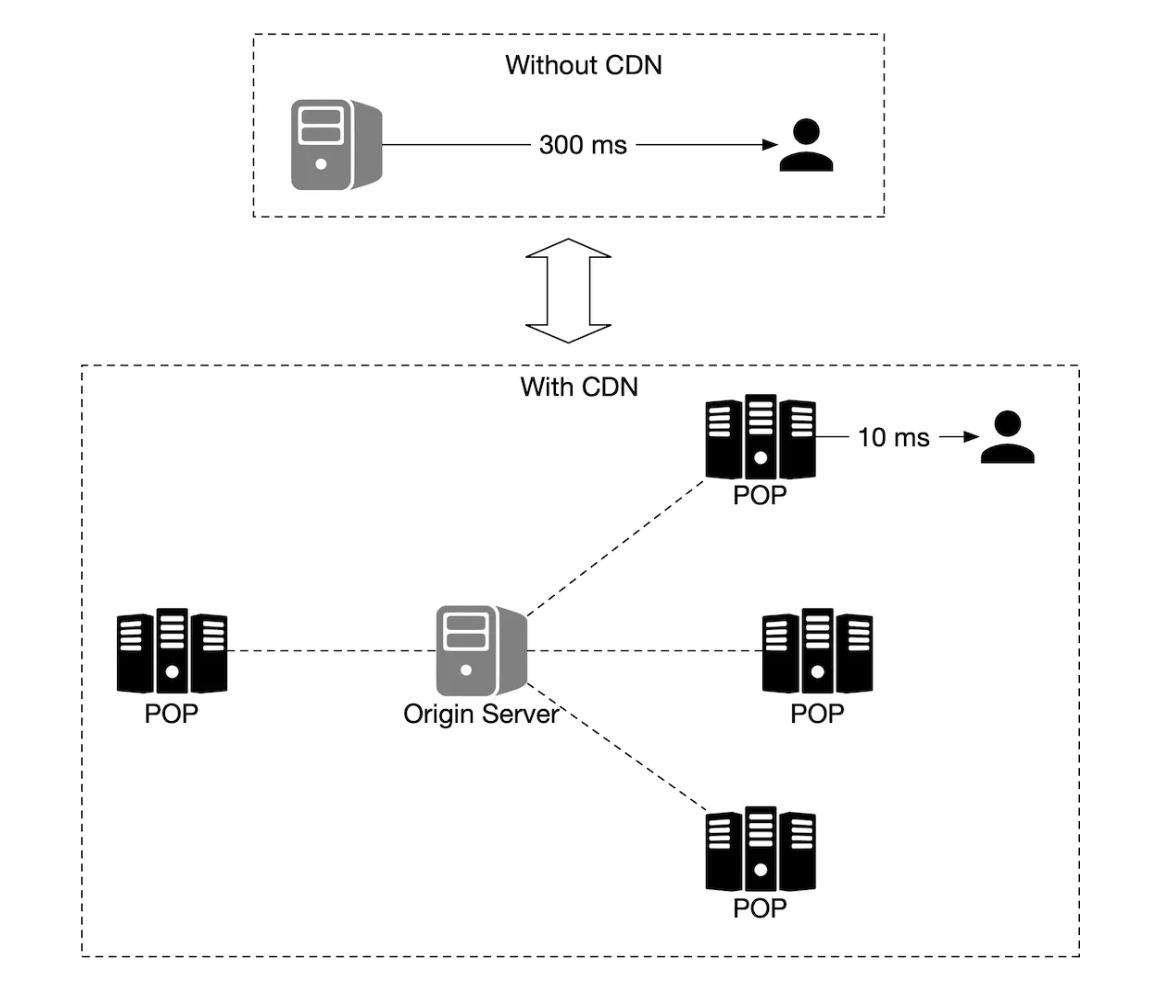
A CDN improves load times by caching static content (images, CSS, JavaScript) on geographically distributed servers.
Redrawn · diagram-design
Workflow
User requests content from the nearest CDN server.
If unavailable, content is fetched from the origin server and cached.
CDN considerations
Cost: CDNs are run by third-party providers which charge for data transfers in and out of the CDN.
Cache Expiry: The cache expiry time should neither be too long nor too short.
CDN fallback: If there is a temporary CDN outage, clients should be able to detect the problem
and request resources from the origin.
Invalidating files: If files are updated the cache should be invalidated to point to the updated files.
Section 8: Stateless Web Tier
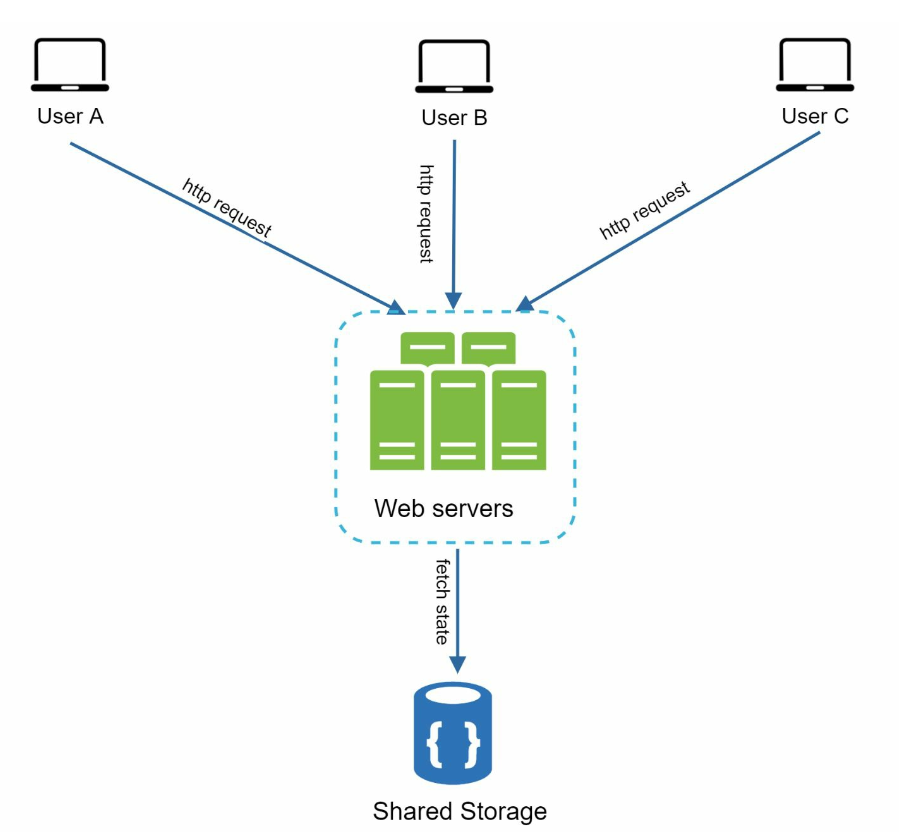
By moving session data to a shared datastore, web servers become stateless. This allows:
Easier horizontal scaling.
Auto-scaling based on traffic.
Redrawn · diagram-design
Section 9: Multi-Data Center Setup
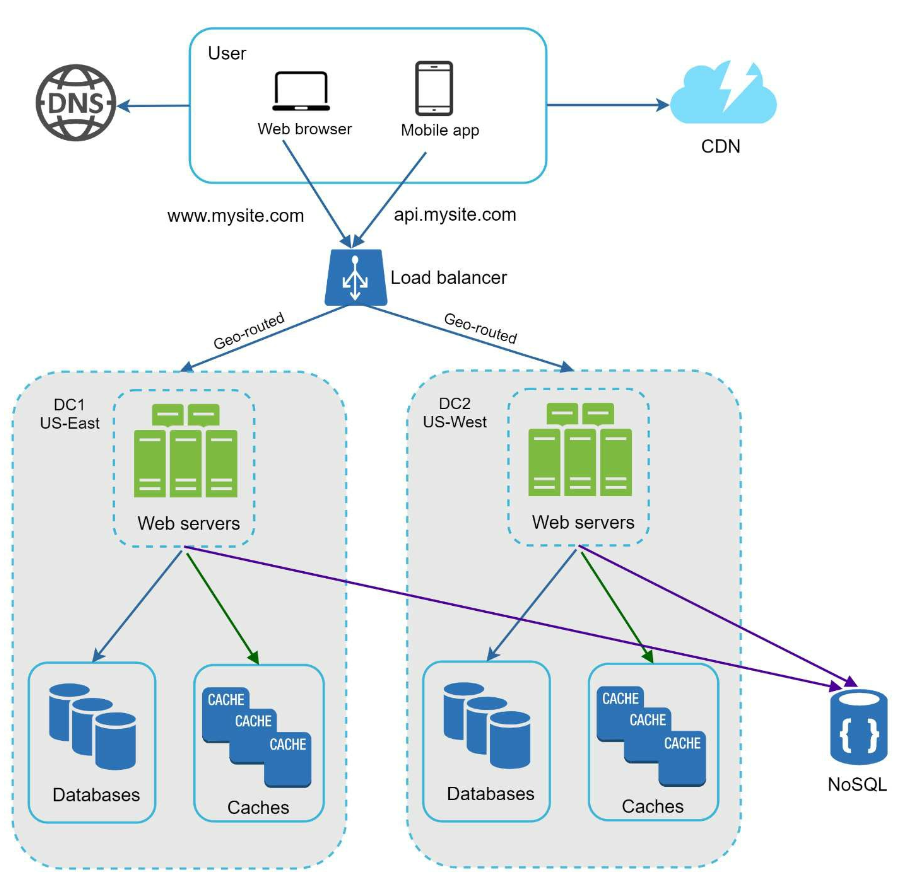
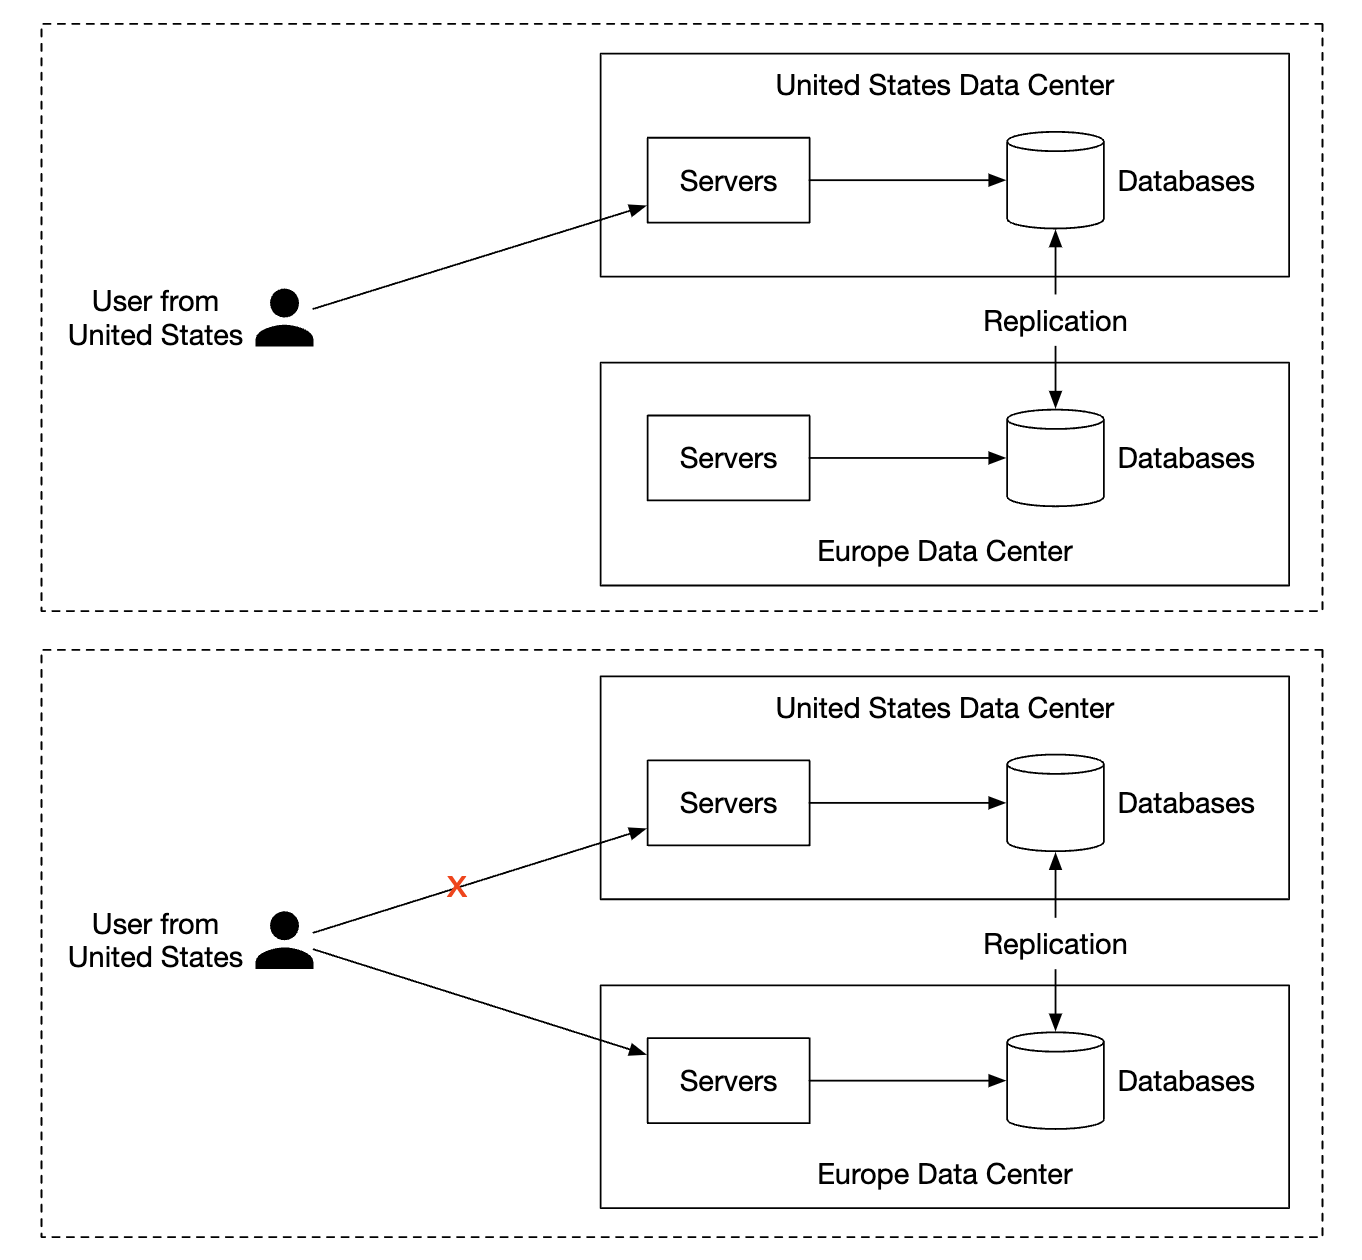
Deploying across multiple data centers improves availability and reduces latency. Strategies include:
Redrawn · diagram-design
GeoDNS Routing: Direct users to the nearest data center.
Data Replication: Synchronize data across centers to prevent inconsistencies.
Key considerations
Traffic redirection: Effective tools are needed to direct traffic to the correct data center.
Data synchronization: A common strategy is to replicate data across multiple data centers.
Test and deployment: Automated deployment tools are vital to keep services consistent through all the data centers.
Section 10: Message Queue
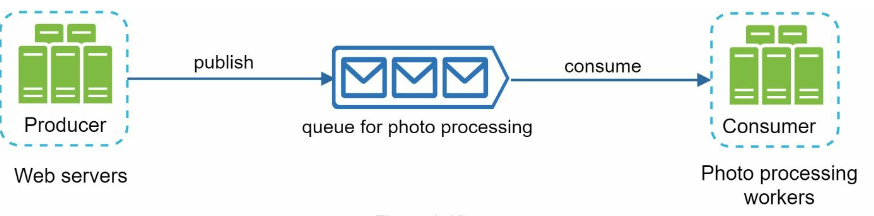
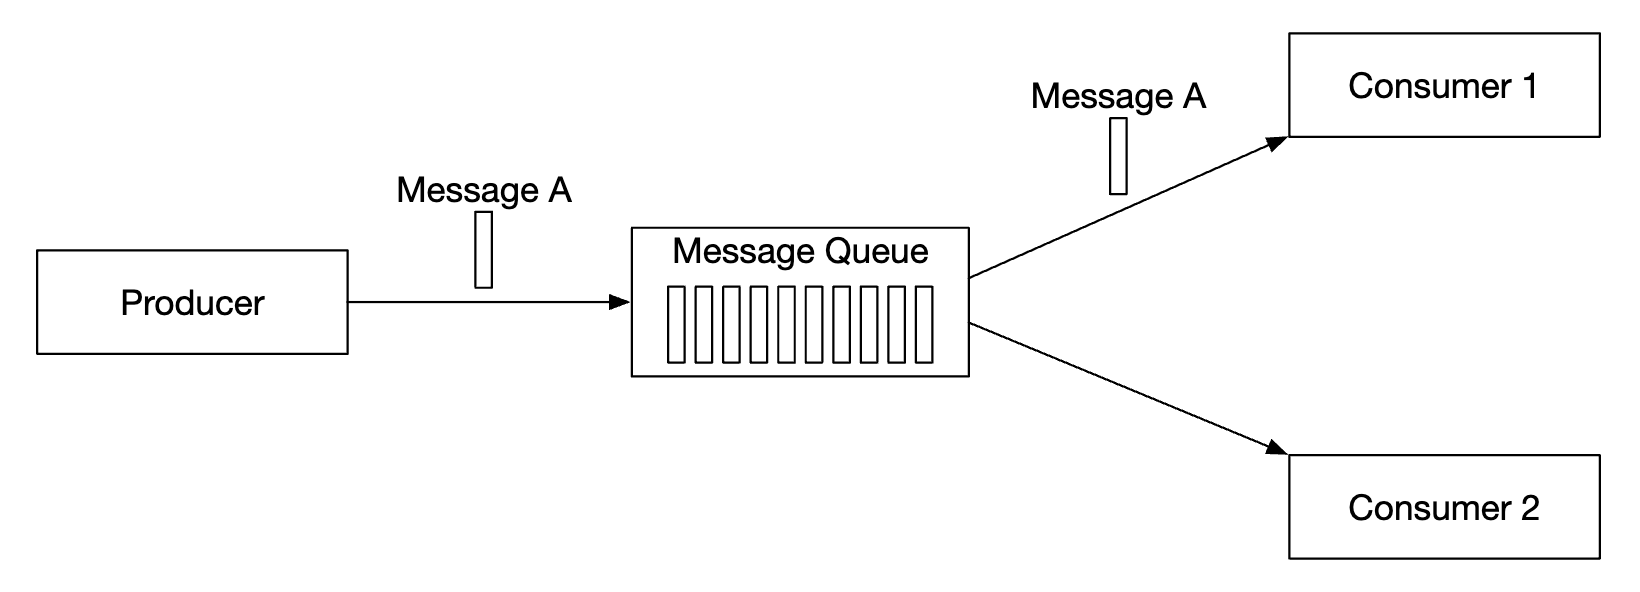
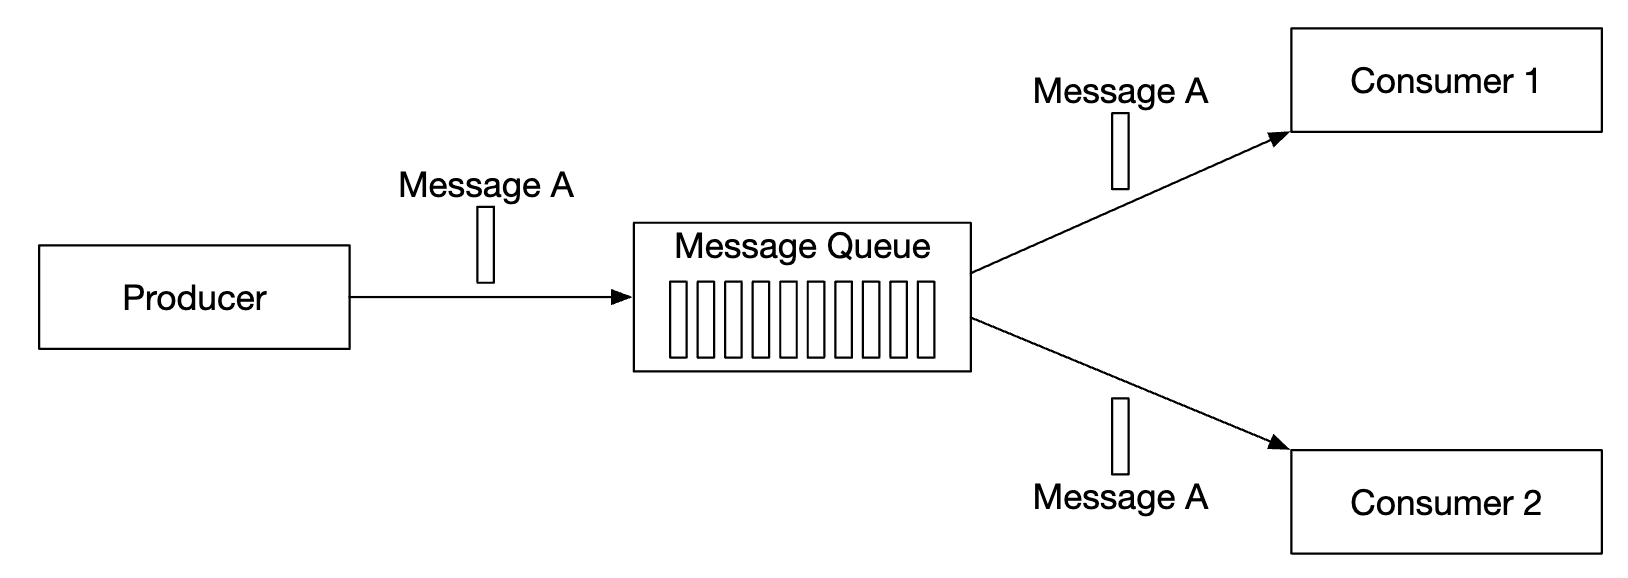
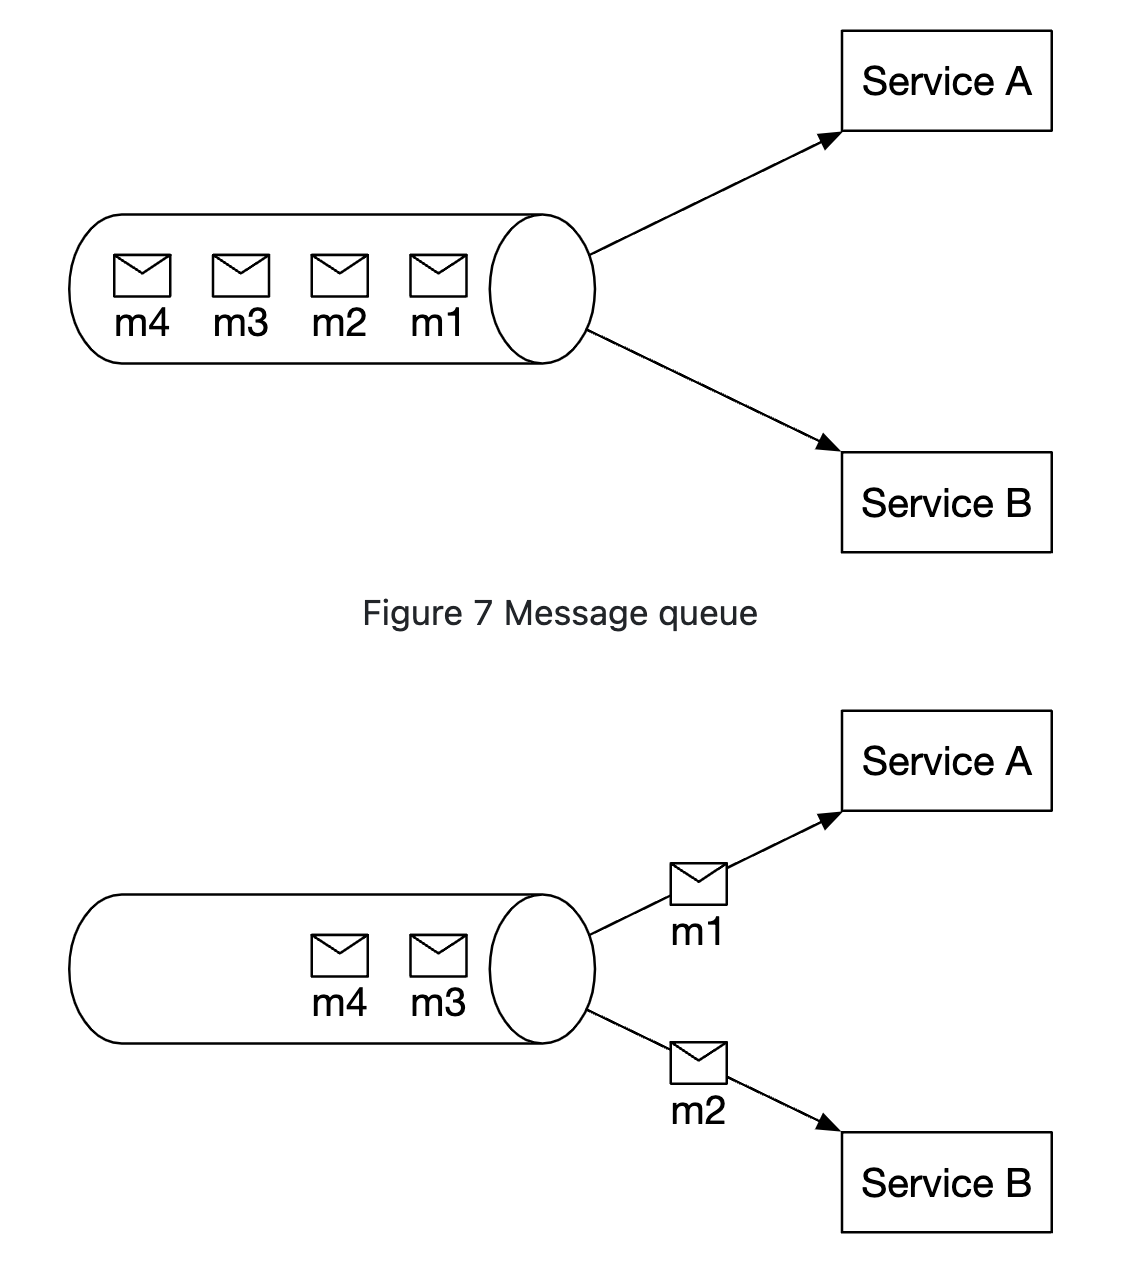
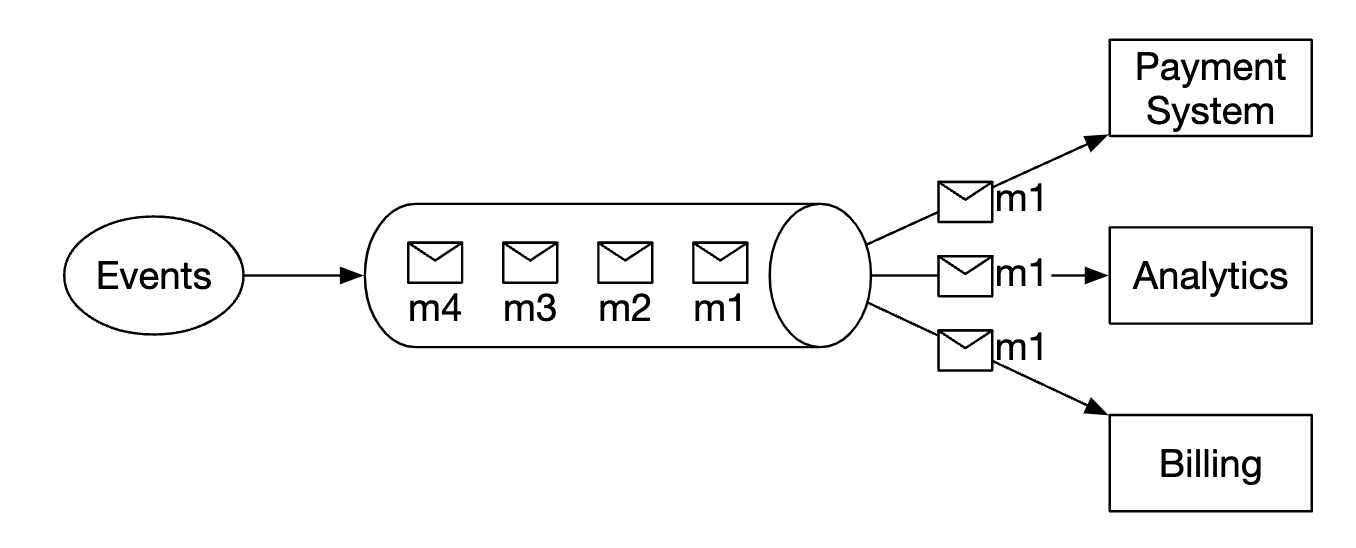
A message queue is a durable component, stored in memory, that supports asynchronous
communication. It serves as a buffer and distributes asynchronous requests.
Redrawn · diagram-design
Input services, called producers/publishers, create messages, and publish them to a message queue.
Other services called consumers/subscribers, connect to the queue, and perform actions defined by the messages.
Section 11: Logging, Metrics, and Automation
Redrawn · diagram-design
Importance
Logging: Tracks errors and system health.
Metrics: Provides insights into performance and user activity.
Automation: Streamlines testing, deployment, and scaling.
Section 12: Database Scaling
Vertical Scaling
Adds hardware resources but has physical and cost limitations.
Has multiple drawbacks:
Greater risk of single point of failures.
Overall cost of vertical scaling is high
Horizontal Scaling (Sharding)
Redrawn · diagram-design
Divides data across multiple shards using keys (e.g., user_id).
Sharding separates large databases into smaller, more easily managed parts called shards.
Each shard shares the same schema, though the actual data on each shard is unique to the shard.
Sharding key is critical when implementing a sharding strategy. When choosing a sharding key it is important to choose a key that can evenly distribute data.
Challenges
Resharding data: Resharding data is needed when:
Single shard could no longer hold more data due to rapid growth.
Certain shards might experience shard exhaustion faster than others due to uneven data distribution.
Consistent Hashing is used to overcome these problems
Celebrity problem: Excessive access to a specific shard could cause server overload.
To solve this problem, we may need to allocate a shard for each celebrity.
Join and de-normalization: Once a database has been sharded across multiple servers, it is hard to perform join operations across database shards.
A common workaround is to de-normalize the database so that queries can be performed in a single table.
Conclusion
Key Takeaways
Keep the web tier stateless.
Build redundancy at every tier.
Use caching and CDNs to optimize performance.
Scale the data tier with sharding.
Decouple components for flexibility.
This chapter provides a solid foundation for building scalable systems that can handle millions of users.
Chapter 2: Back-of-the-Envelope Estimation
Introduction
Back-of-the-envelope estimation is a crucial skill in system design interviews. It involves making quick, rough calculations to assess system capacity or performance. According to Jeff Dean, Google Senior Fellow, these estimates help evaluate whether designs meet requirements through thought experiments and common performance benchmarks.
This chapter covers key concepts, methodologies, and examples to build proficiency in scalability and estimation.
Section 1: Key Concepts
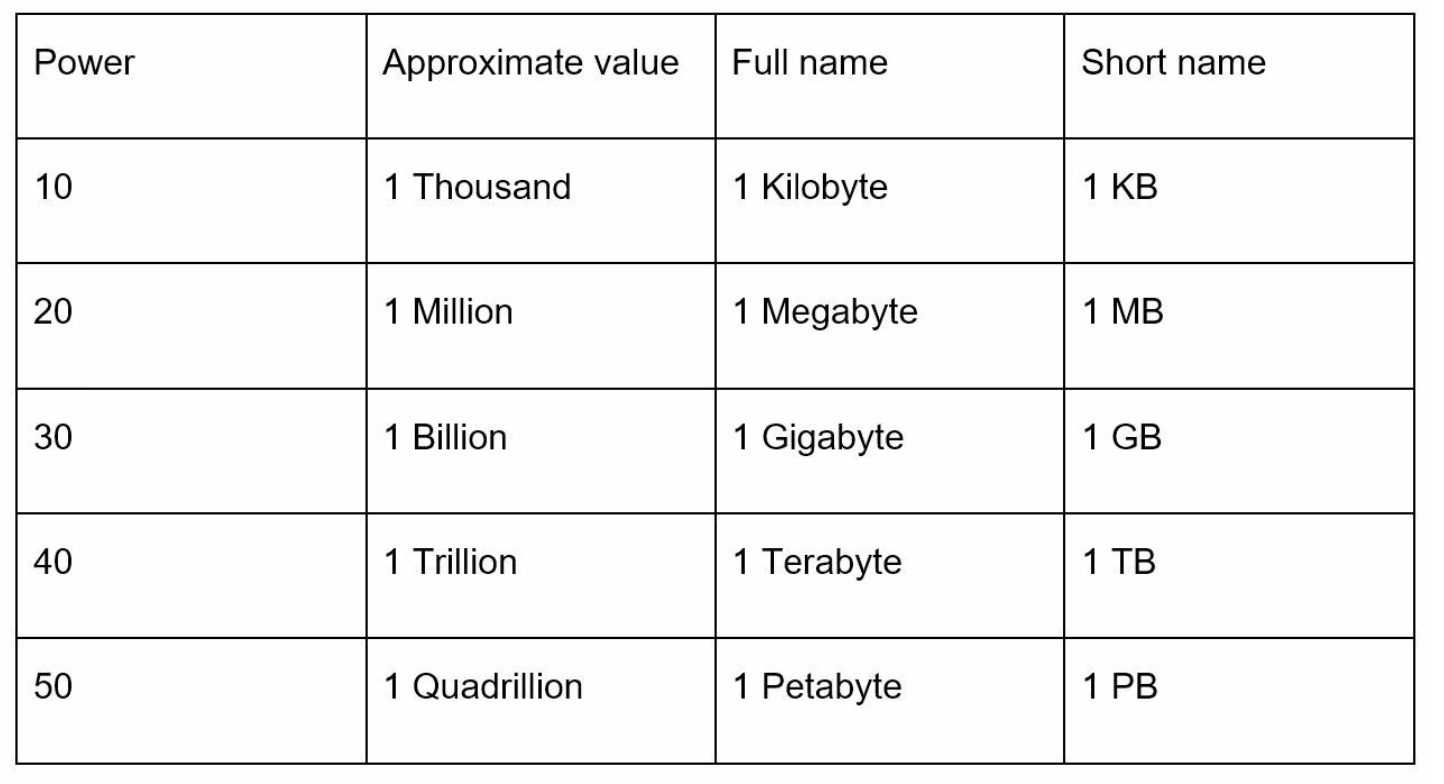
Power of Two
Understanding data volume in terms of powers of two is fundamental:
Redrawn · diagram-design
This knowledge helps in performing accurate storage and bandwidth calculations.
Latency Numbers Every Programmer Should Know
Latency numbers represent the time taken for various operations in computing systems. These provide insights into relative performance:
Operation
Latency (2020)
L1 Cache Access
0.5 ns
L2 Cache Access
7 ns
Main Memory Access
100 ns
SSD Random Read
150 µs
HDD Random Seek
10 ms
Round-Trip in Data Center
500 µs
Inter-Region Data Center
150 ms
Key Insights:
Memory is fast, disk is slow.
Avoid disk seeks whenever possible.
Compress data before transmitting over the internet to save bandwidth.
Availability Numbers
High availability (HA) ensures minimal downtime. Availability is expressed in nines:
99% (Two Nines): ~3.65 days/year of downtime
99.9% (Three Nines): ~8.8 hours/year of downtime
99.99% (Four Nines): ~52 minutes/year of downtime
99.999% (Five Nines): ~5.3 minutes/year of downtime
99.9999% (Six Nines): ~31.56 seconds/year of downtime
Cloud providers like Amazon, Google, and Microsoft aim for SLAs (Service Level Agreements) of 99.9% or higher.
Section 2: Example Estimation - Twitter QPS and Storage Requirements
Daily Media Storage:150M x 2 x 10% x 1MB = 30TB per day
5-Year Storage:30TB x 365 x 5 = ~55PB
Section 3: Tips for Effective Estimation
1. Rounding and Approximation
Precision is not critical; focus on the process. Simplify complex calculations using round numbers. For example:
99987 / 9.1 can be approximated as 100,000 / 10 = 10,000.
2. Write Down Assumptions
Document assumptions clearly for future reference.
3. Label Units
Avoid ambiguity by labeling units (e.g., 5 MB instead of 5).
4. Common Estimation Scenarios
QPS (Queries Per Second): Measure traffic intensity.
Peak QPS: Account for traffic spikes.
Storage Requirements: Estimate total data needs.
Cache Requirements: Evaluate memory requirements for caching.
Number of Servers: Calculate hardware needs based on workload.
Chapter 3: A Framework for System Design Interviews
Introduction
System design interviews are a key part of the hiring process, simulating real-life problem-solving scenarios. These interviews evaluate not just technical skills but also collaboration, communication, and the ability to handle ambiguous requirements.
This chapter introduces a 4-step framework for navigating system design interviews effectively.
Step 1: Understand the Problem and Establish Design Scope
Key Objectives
Clarify requirements and assumptions.
Avoid jumping into solutions prematurely.
Showcase critical thinking by asking good questions.
Approach
Ask Clarifying Questions:
What are the most important features?
What scale does the system need to handle?
Are we building for web, mobile, or both?
Are there existing technologies or constraints?
Document Assumptions: Write assumptions on a whiteboard or paper for reference.
Example
Problem: Design a news feed system. Questions:
Is it a mobile app, web app, or both?
How many friends can a user have?
Should the feed include images and videos?
Is the feed sorted by reverse chronological order?
Step 2: Propose High-Level Design and Get Buy-In
Key Objectives
Develop a high-level architecture.
Collaborate with the interviewer to refine the design.
Approach
Draft a Blueprint:
Use box diagrams for key components (e.g., clients, APIs, databases, caches, CDNs).
Treat the interviewer as a teammate to refine the design.
Perform Back-of-the-Envelope Calculations:
Ensure the design can handle the scale constraints.
Walk Through Use Cases: Identify edge cases and validate design assumptions.
Example
For a news feed system, divide the design into:
Feed Publishing Flow: Writing posts into databases and populating friends' feeds.
Feed Retrieval Flow: Aggregating and displaying friends' posts in reverse chronological order.
Step 3: Design Deep Dive
Key Objectives
Dive into critical components.
Showcase depth of understanding and adaptability.
Approach
Prioritize Key Components: Focus on areas most relevant to the problem.
Discuss Bottlenecks: Identify potential performance issues and propose solutions.
Balance Detail: Avoid over-engineering or unnecessary deep dives.
Example Topics
URL Shortener: Focus on hash function design.
Chat System: Explore latency reduction and online/offline status handling.
News Feed System: Examine feed publishing and retrieval processes.
Step 4: Wrap-Up
Key Objectives
Highlight areas for improvement.
Recap the design and discuss follow-ups.
Approach
Identify Bottlenecks: Discuss potential limitations and scaling strategies.
Summarize Design: Recap major design decisions and trade-offs.
Propose Enhancements:
How to scale from 1 million to 10 million users.
Error handling for server failures or network issues.
Best Practices
Dos
Ask Questions: Clarify ambiguities before diving into solutions.
Communicate: Share your thought process with the interviewer.
Iterate with the Interviewer: Treat them as a collaborator.
Show Flexibility: Suggest alternative approaches and refine your design.
Focus on Critical Components: Prioritize key parts of the system.
Don’ts
Avoid Premature Solutions: Don’t design before understanding the requirements.
Don’t Go Silent: Communicate regularly during the process.
Avoid Over-Engineering: Focus on practical, scalable solutions.
Time Management
Suggested Time Allocation (for 45-Minute Interviews):
Understand Problem and Scope: 3–10 minutes
High-Level Design and Buy-In: 10–15 minutes
Deep Dive: 10–25 minutes
Wrap-Up: 3–5 minutes
Chapter 4: Design a Rate Limiter
Introduction
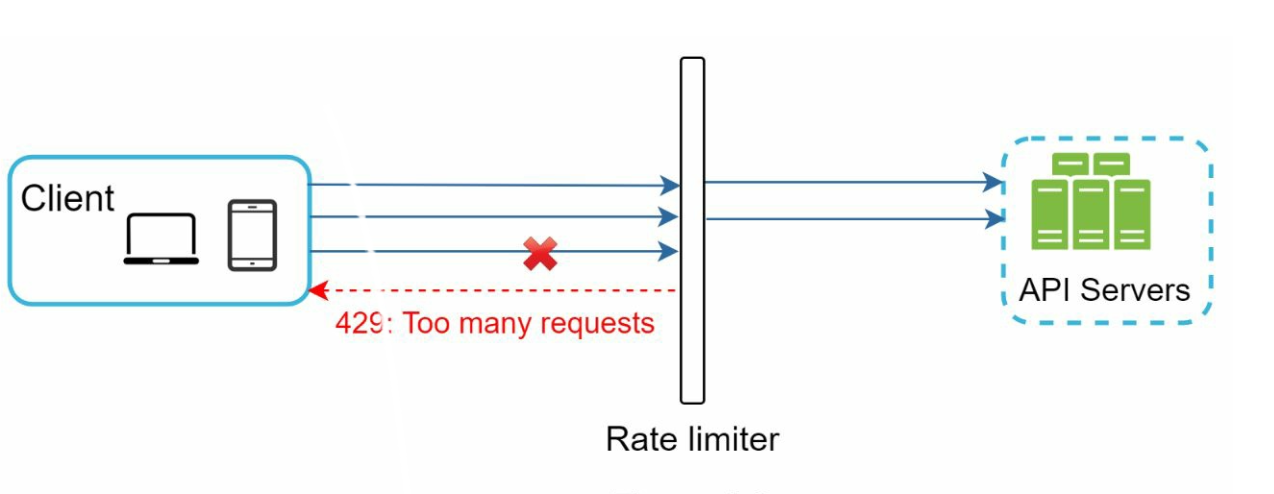
This chapter explores the design and implementation of a rate limiter—a system component used to control traffic rates sent by clients or services. Rate limiters are crucial for preventing abuse, reducing costs, and ensuring the stability of server resources. Examples of their use include limiting posts, account creations, and reward claims.
Benefits of Rate Limiting
Preventing DoS Attacks: Blocking excess calls to avoid resource starvation.
Cost Reduction: Limiting unnecessary requests to reduce server expenses.
Preventing Overloads: Filtering out excessive requests to stabilize server performance.
Step 1: Understanding the Problem
Key Features
Server-side API rate limiter.
Support for multiple throttle rules.
Handle large-scale systems in distributed environments.
Option for a standalone service or application-level code.
Inform users when throttled.
Requirements
Accurate request throttling.
Minimal latency.
Low memory usage.
Distributed capability.
Clear exception handling.
High fault tolerance.
Step 2: High-Level Design
Placement Options
Redrawn · diagram-design
Client-Side Implementation: Unreliable due to potential misuse.
Server-Side Implementation: Preferred for control and reliability.
Middleware (API Gateway): A flexible option for integrated rate limiting.
Guidelines for Placement
Evaluate current tech stack and choose efficient options.
Select appropriate algorithms based on business needs.
Use an API gateway if microservices are employed.
Opt for commercial solutions if resources are limited.
Step 3: Rate Limiting Algorithms
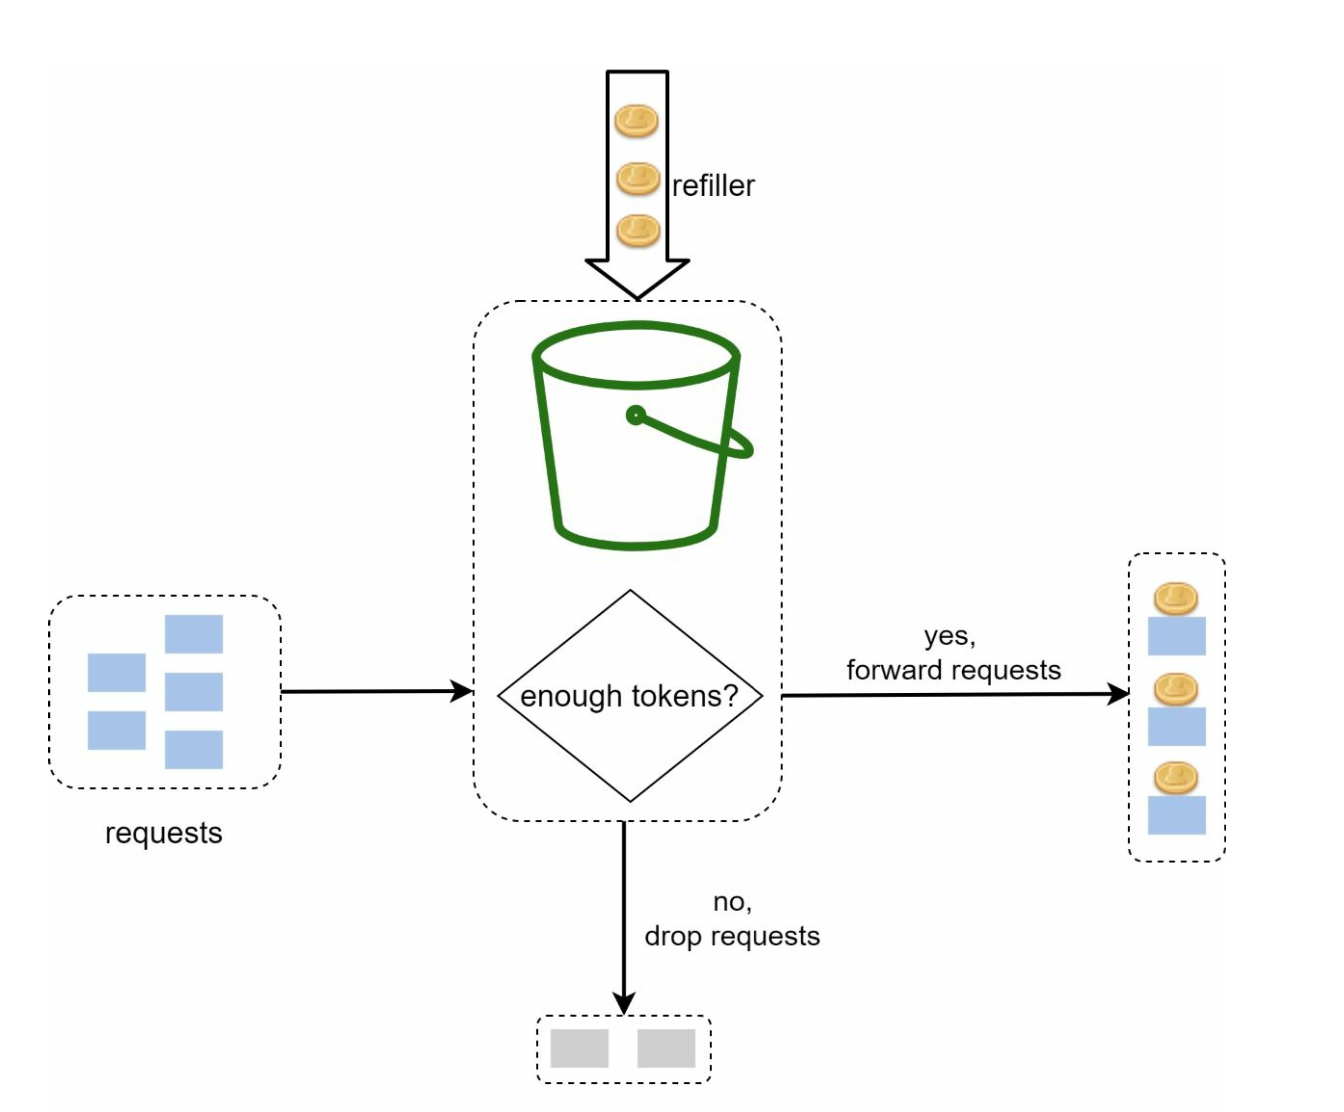
1. Token Bucket
Redrawn · diagram-design
Description: Tokens are added to a bucket at a fixed rate; each request consumes a token.
Parameters: Bucket size and refill rate.
Pros: Easy to implement, memory-efficient, supports traffic bursts.
Cons: Requires careful parameter tuning.
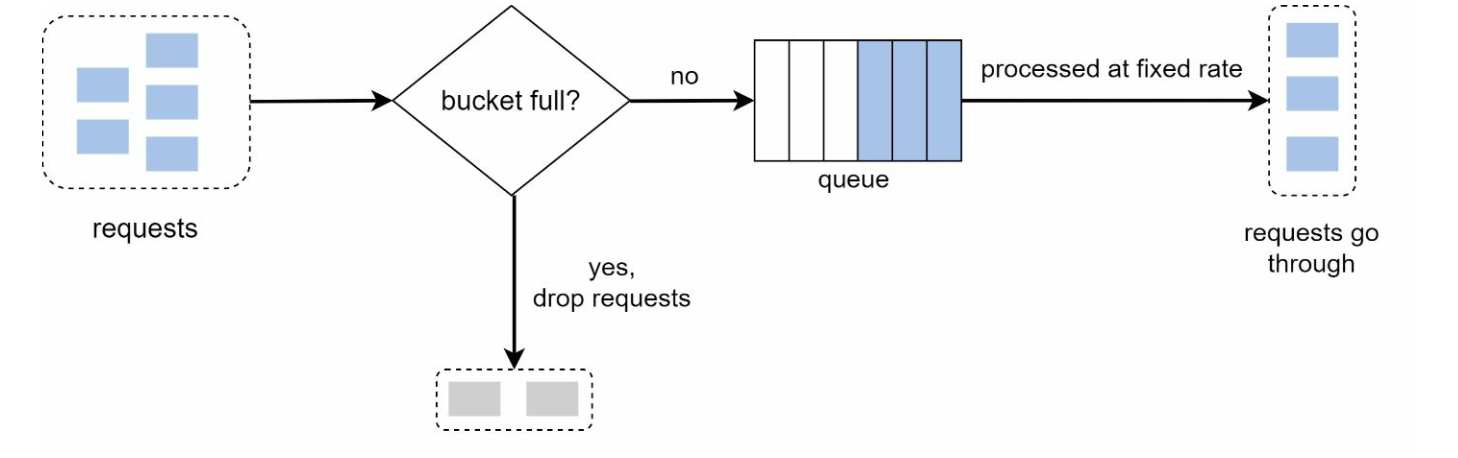
2. Leaking Bucket
Redrawn · diagram-design
Description: Processes requests at a fixed rate using a FIFO queue.
Solutions: Use locks, Lua scripts, or sorted sets in Redis. Employ centralized data stores for synchronization.
Performance Optimizations
Multi-data center setups for reduced latency.
Eventual consistency models for synchronization.
Monitoring
Regular analytics to ensure algorithm effectiveness and adjust rules as needed.
Chapter 5: Design Consistent Hashing
Introduction
This chapter explores consistent hashing, a technique essential for achieving horizontal scaling by efficiently distributing requests and data across servers. It minimizes data redistribution when servers are added or removed and ensures an even distribution of data to mitigate issues like server hotspots.
The Rehashing Problem
Explanation
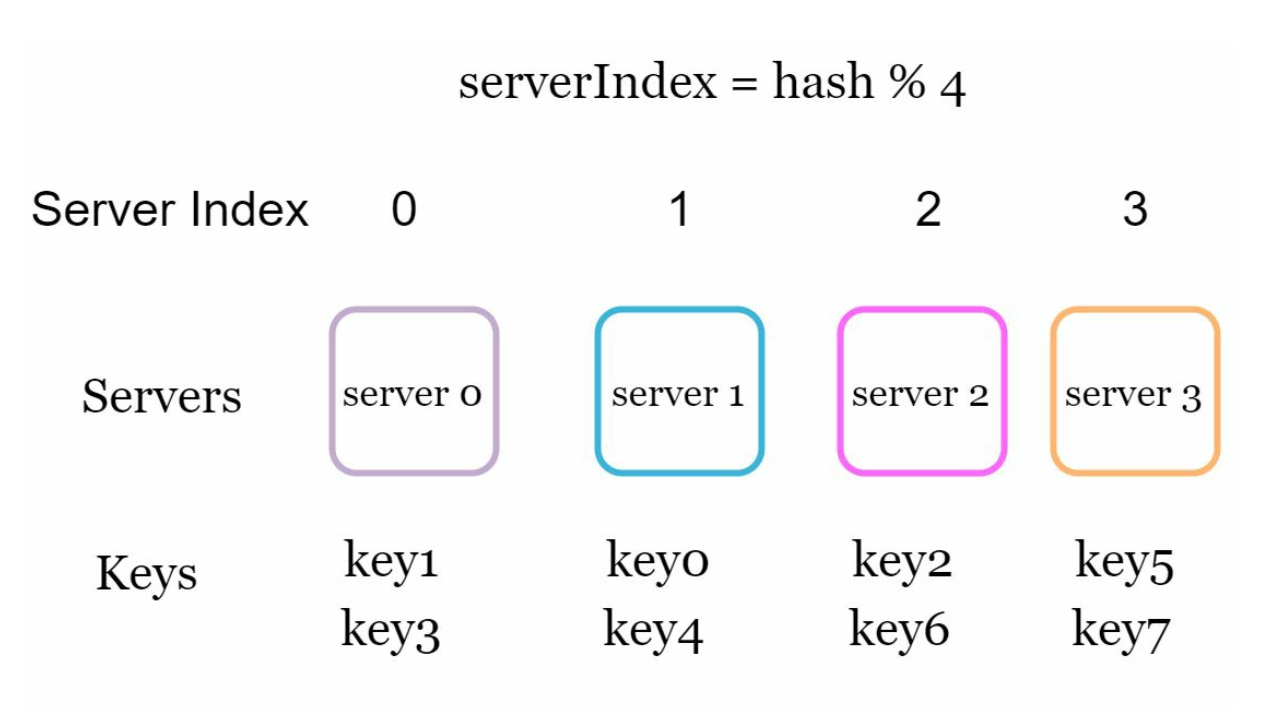
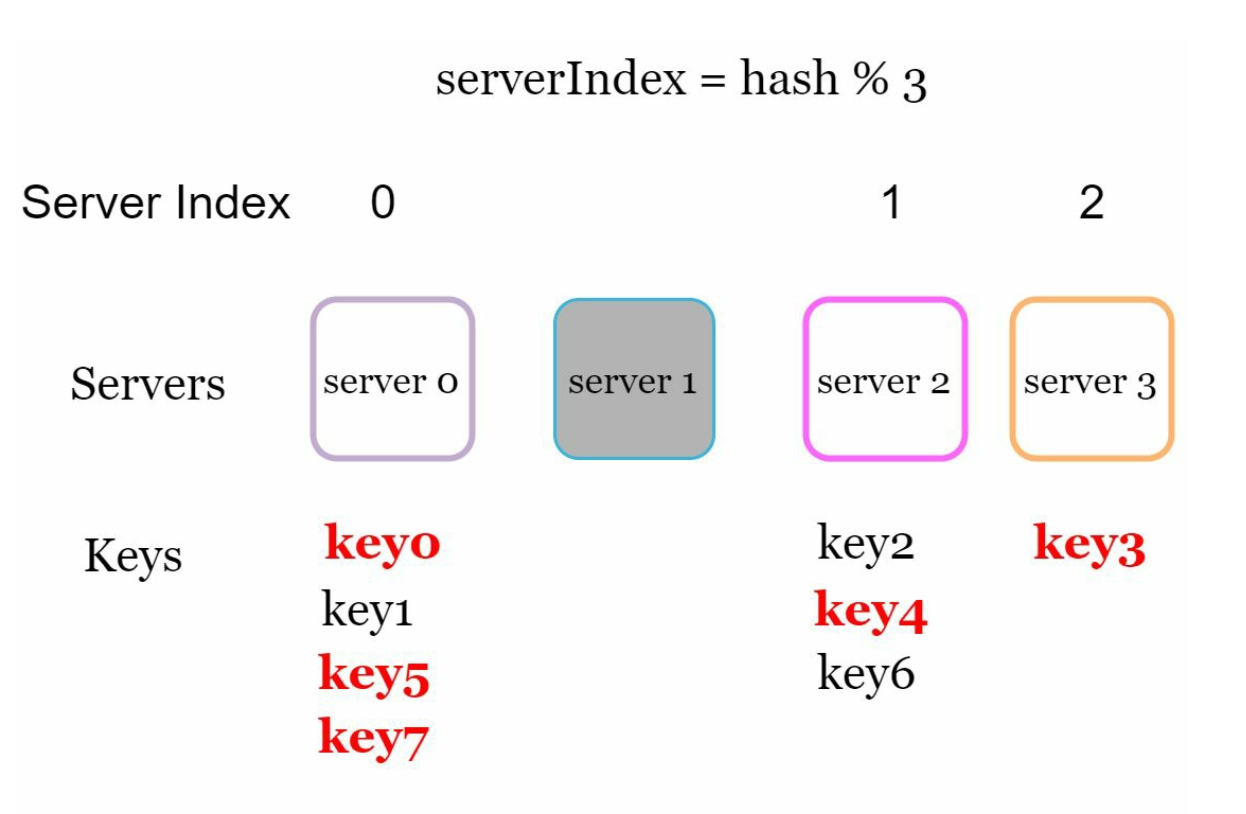
In traditional hashing methods, such as serverIndex = hash(key) % N, data redistribution becomes problematic when the number of servers changes. For example:
Removing a server causes most keys to be reassigned, leading to cache misses.
Adding a server results in unnecessary key redistributions.
Redrawn · diagram-design
This approach works well when the size of the server pool is fixed. However, problems arise when new servers are added, or existing servers are removed.
Redrawn · diagram-design
Key Issue
Redistribution of most keys when server count changes causes inefficiency and overload.
Consistent Hashing
Definition
Consistent hashing ensures that only a fraction of keys are remapped when servers are added or removed. This minimizes disruptions and enhances scalability.
Key Concepts
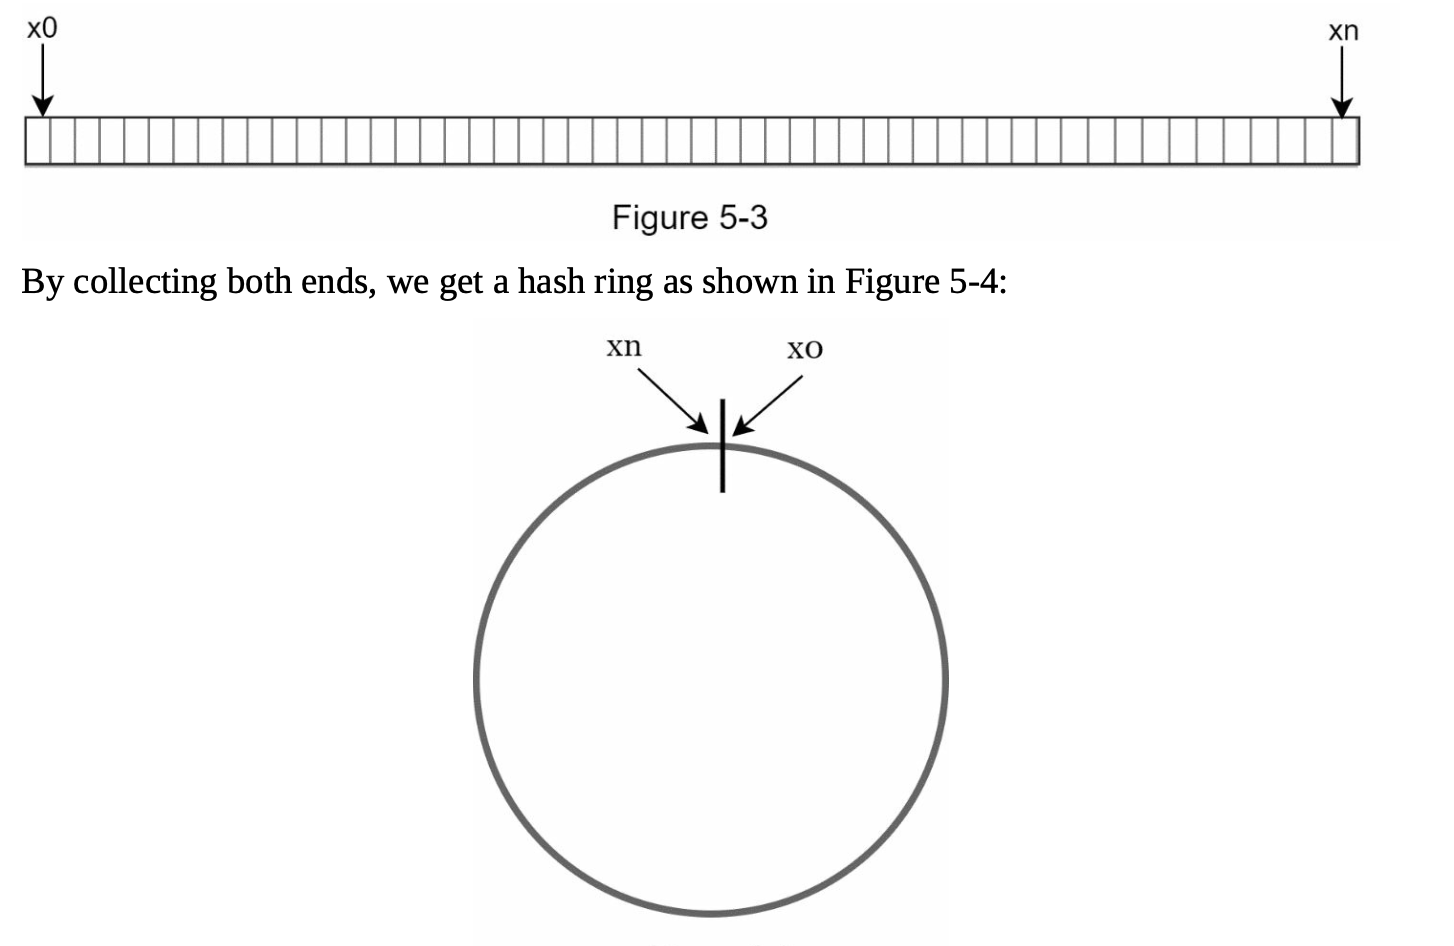
Hash Space and Ring: The hash space forms a continuous ring, with hash values distributed from 0 to 2^160-1 (e.g., using hash function like SHA-1). By connecting both ends we get a ring.
Redrawn · diagram-design
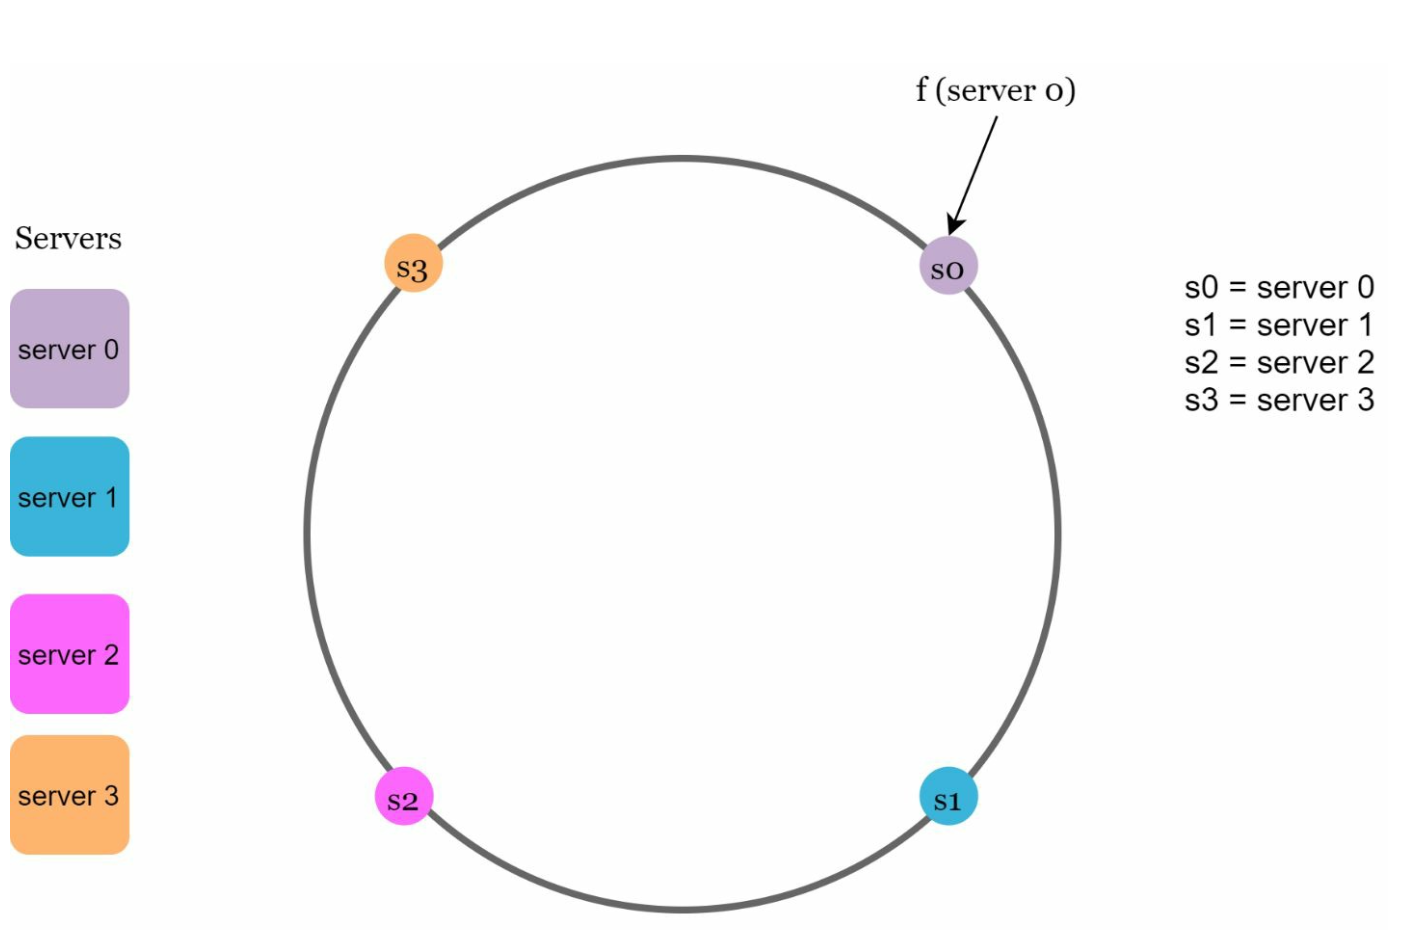
Using the same hash function f, we map servers based on server IP or name onto the ring.
Redrawn · diagram-design
Server Lookup
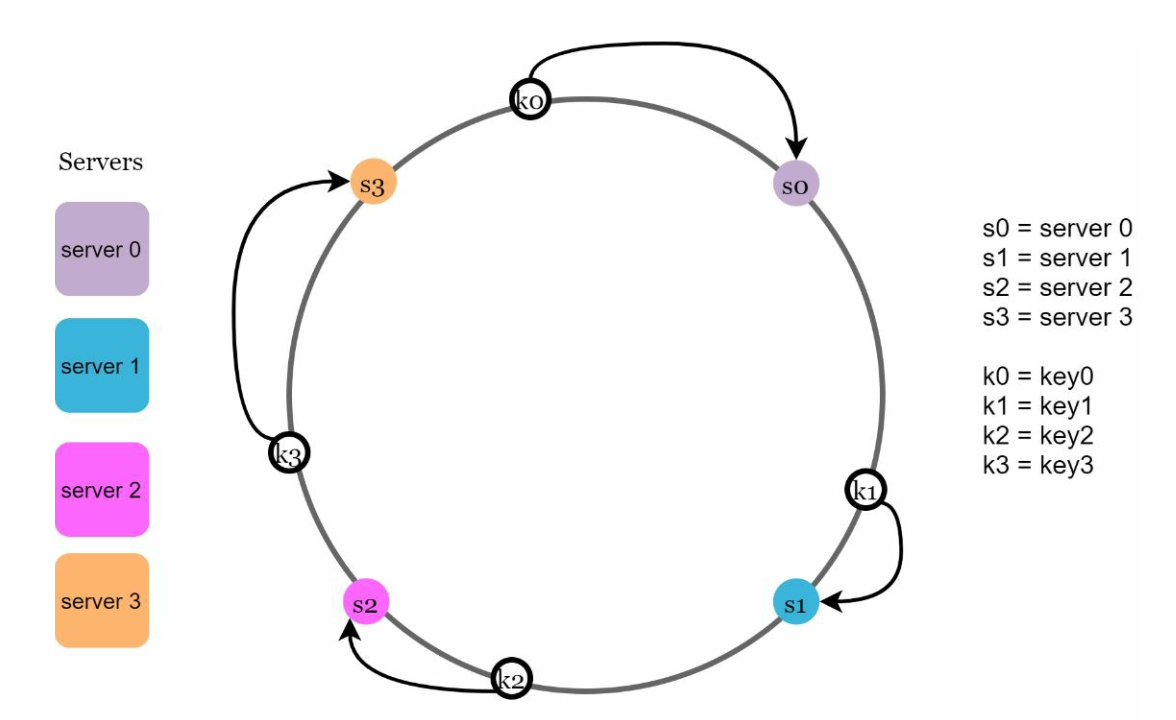
A key's server is determined by traversing clockwise on the ring until a server is found.
Redrawn · diagram-design
Adding and Removing Servers
Adding a server redistributes only nearby keys. Only a fraction of keys are redistributed to the new server.
Redrawn · diagram-design
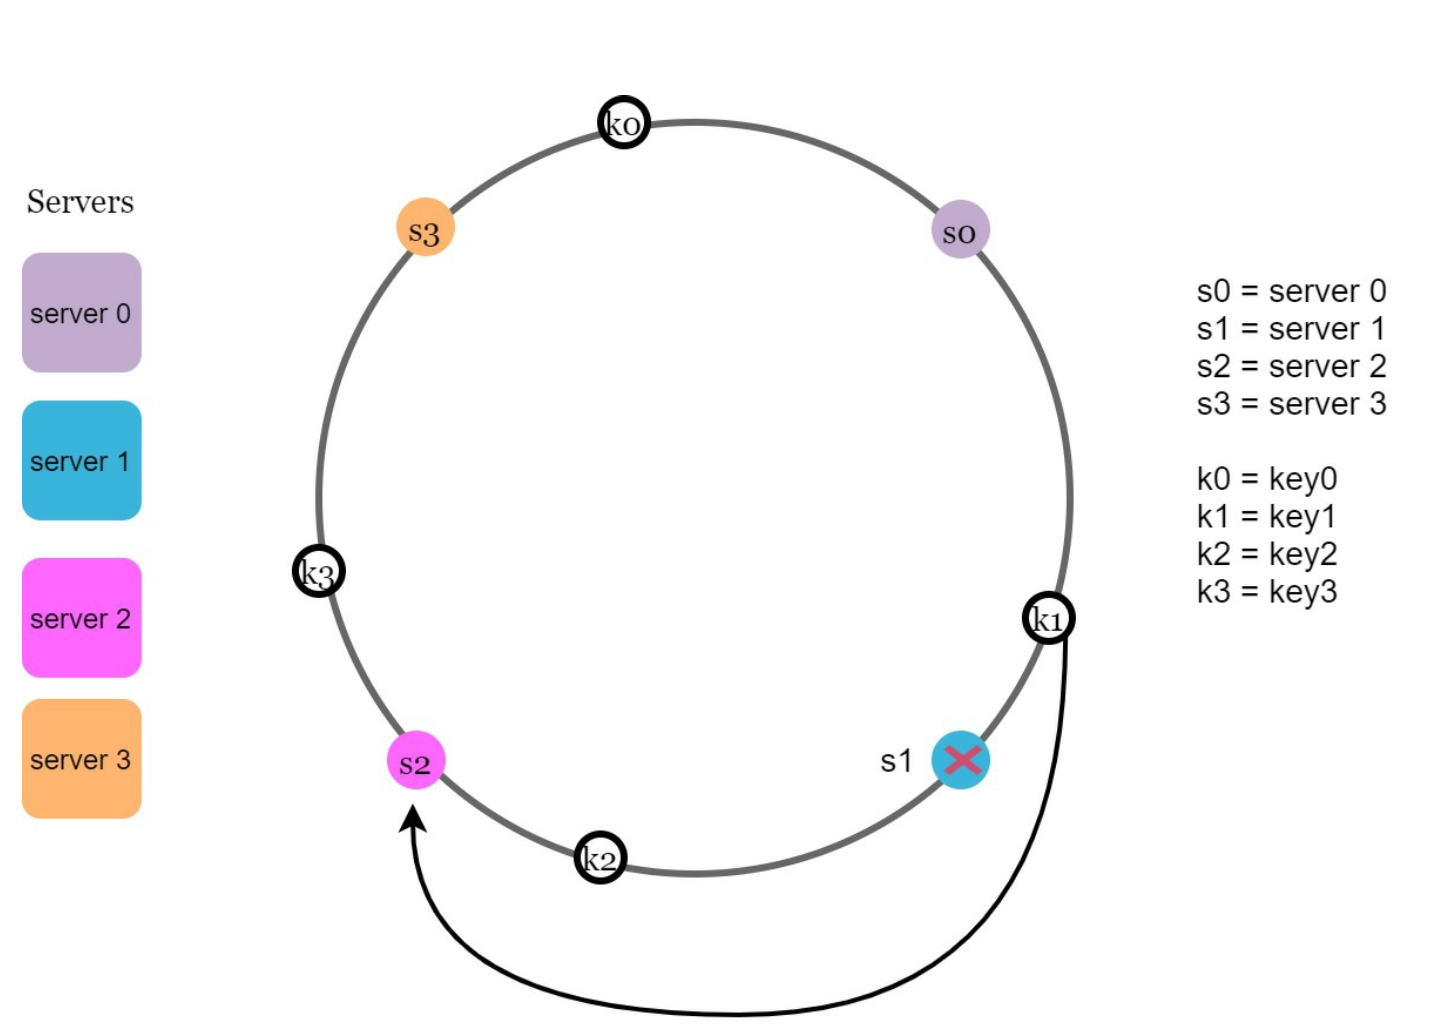
Removing a server affects only the keys in its range. Only keys from the removed server are reassigned to the next server clockwise.
Redrawn · diagram-design
Challenges and Solutions
Two Issues in Basic Approach
Uneven Partition Sizes: Servers may have unequal data partitions.
Non-uniform Key Distribution: Some servers may receive significantly more keys than others.
Solution: Virtual Nodes
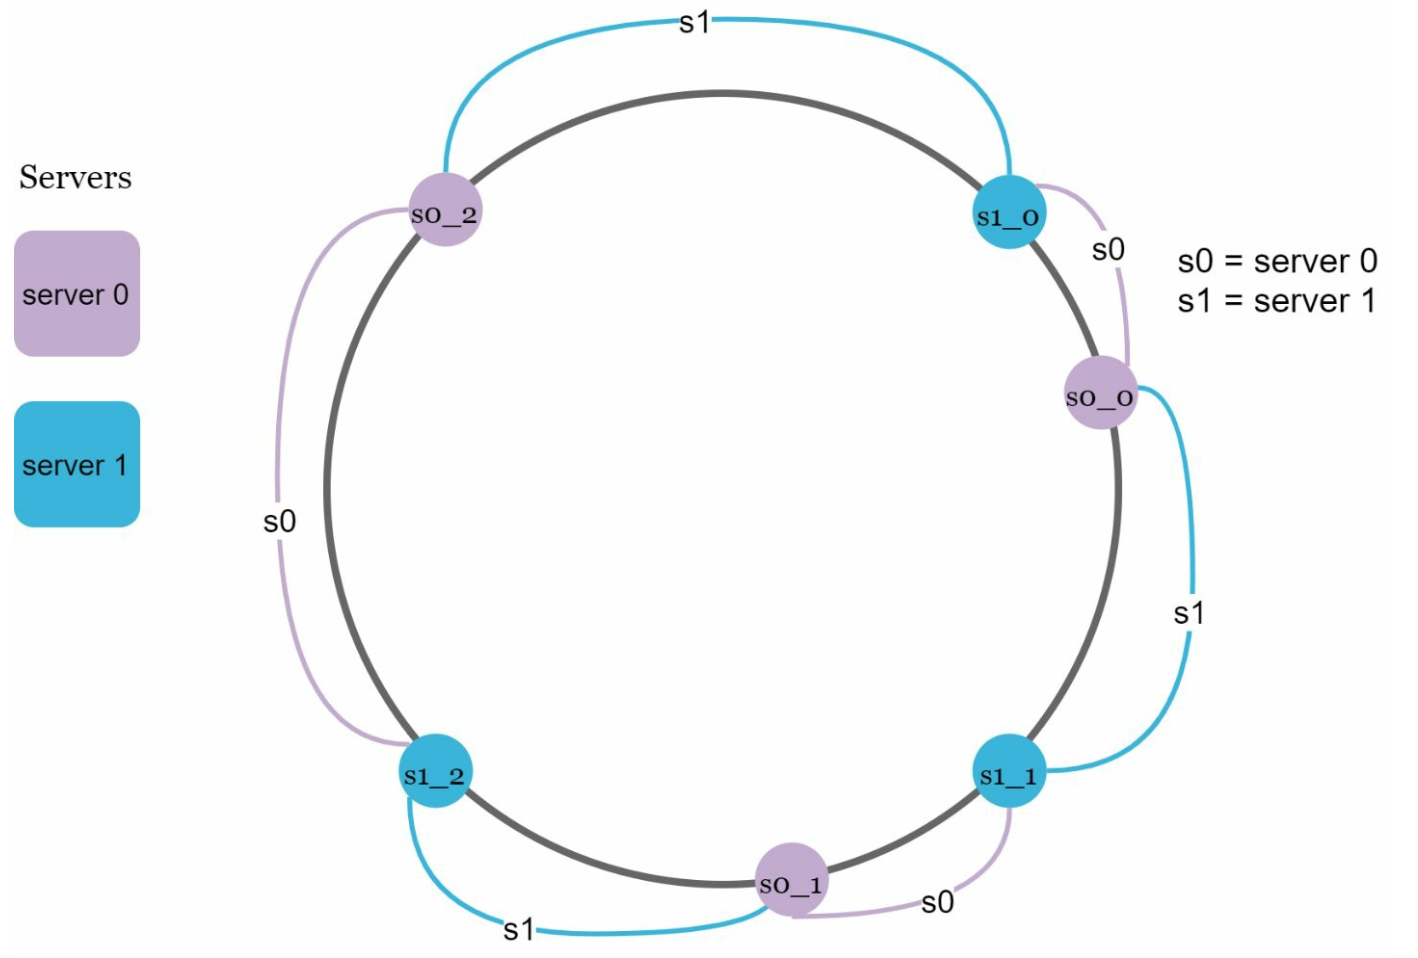
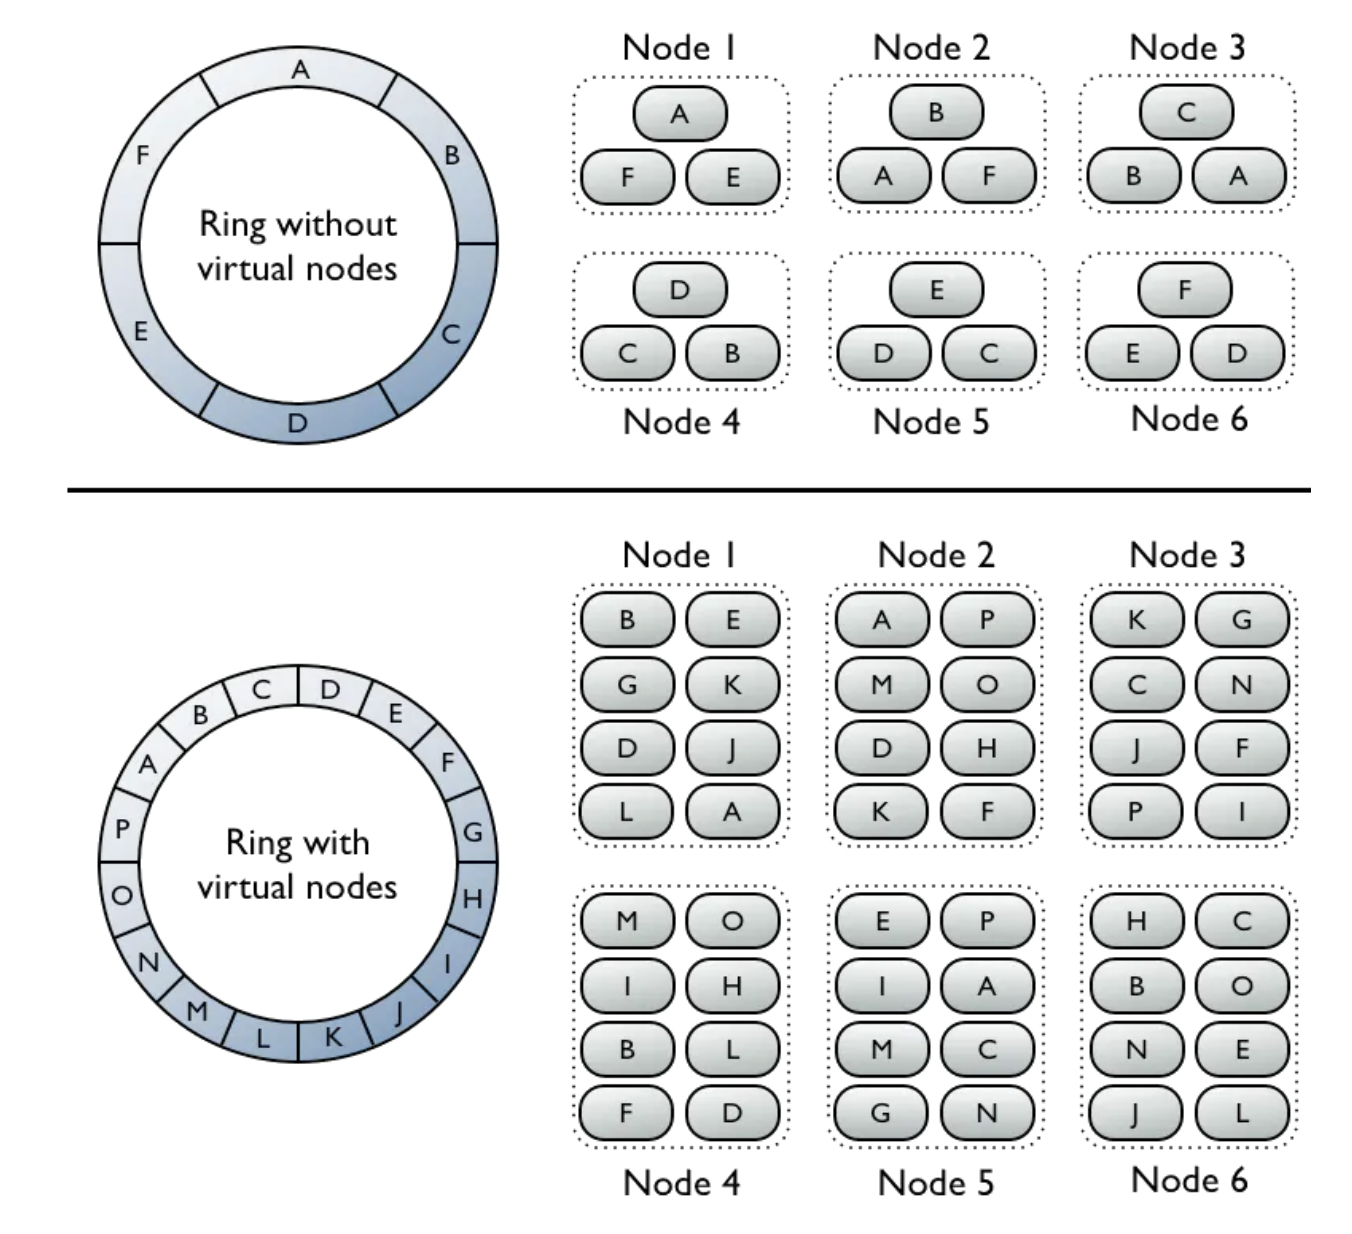
Each server is represented by multiple virtual nodes on the ring uniformly distrubuted on the ring.
Virtual nodes improve key distribution and balance load. As the number of virtual nodes increases, the distribution of keys becomes more balanced. This is because the standard deviation gets smaller with more virtual nodes, leading to balanced data distribution.
Redrawn · diagram-design
Affected Keys
When servers are added or removed:
Added Server: Affected keys are those between the new server and its predecessor.
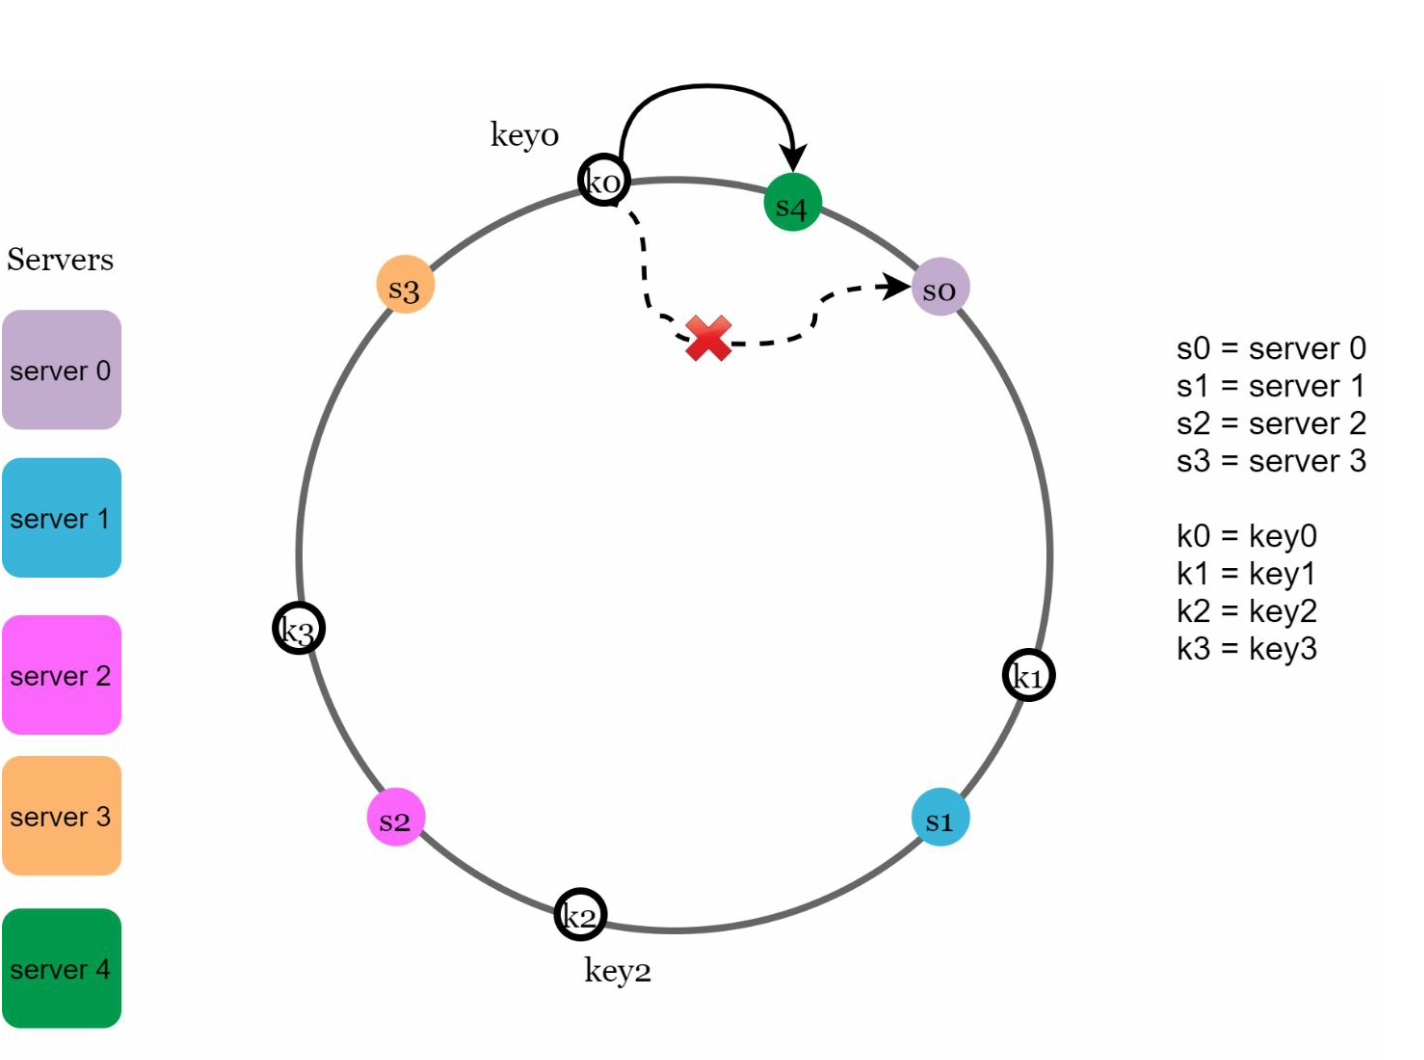
In the following example server 4 is added onto the ring. The affected range starts from s4 (newly
added node) and moves anticlockwise around the ring until a server is found (s3). Thus, keys
located between s3 and s4 need to be redistributed to s4.
Redrawn · diagram-design
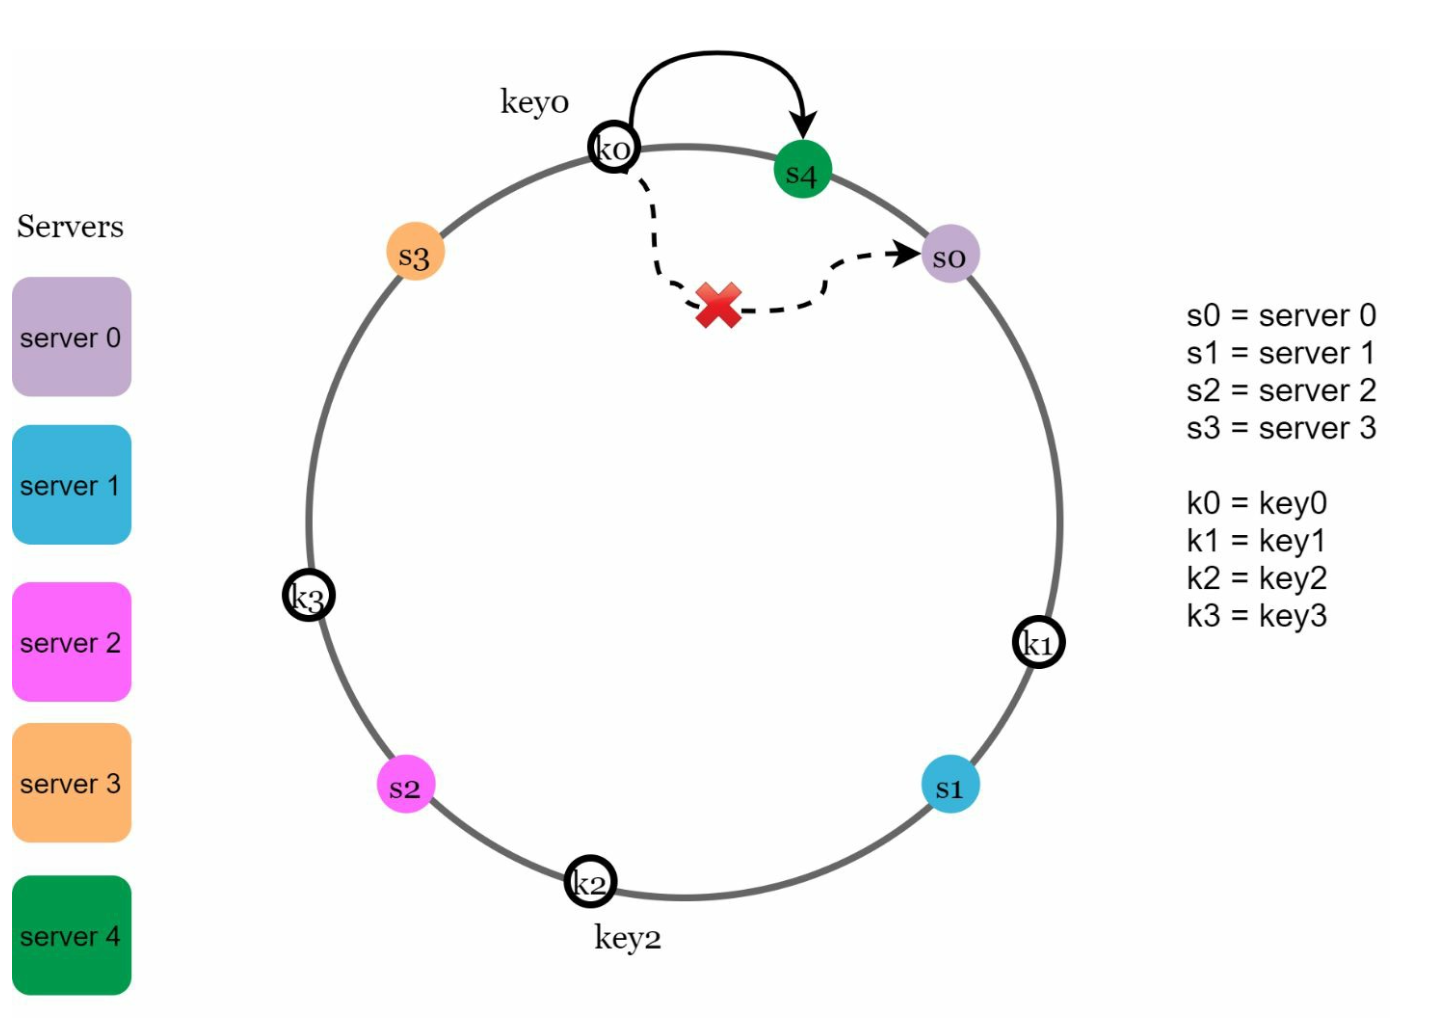
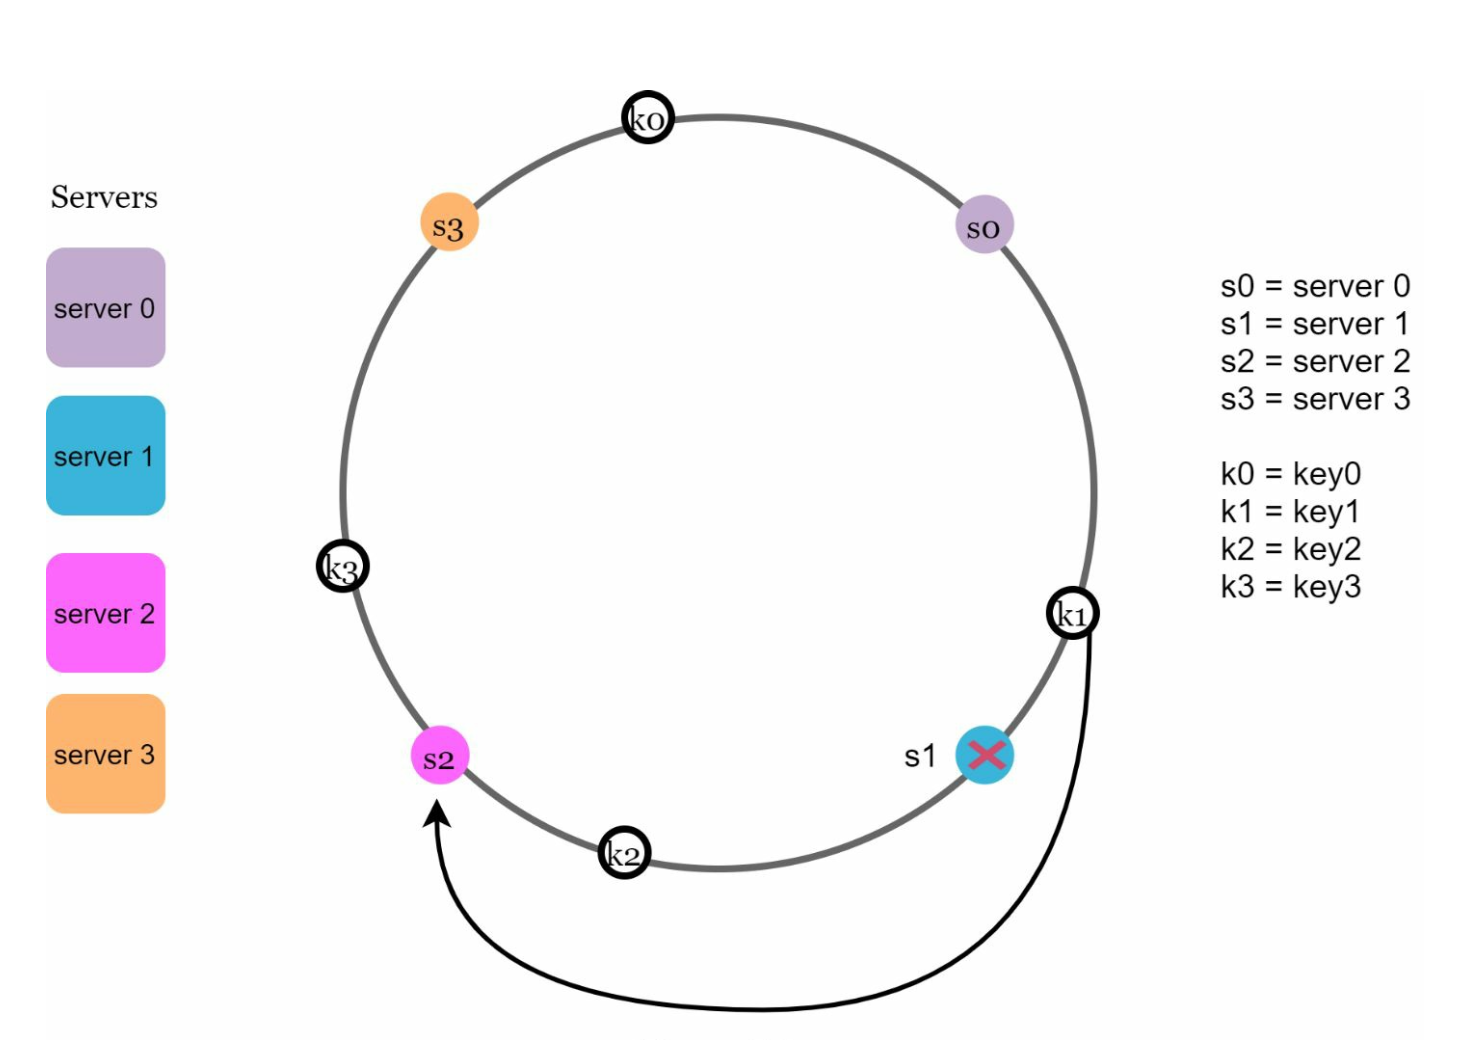
Removed Server: Affected keys are those between the removed server and its predecessor. In the following example when a server (s1) is removed, the affected range starts from s1
(removed node) and moves anticlockwise around the ring until a server is found (s0). Thus, keys located between s0 and s1 must be redistributed to s2.
Redrawn · diagram-design
Benefits of Consistent Hashing
Minimized Redistribution: Only a fraction of keys are reassigned.
Scalability: Enables horizontal scaling.
Mitigates Hotspots: Balances data distribution to avoid server overload.
Real-World Applications
Amazon Dynamo DB
Apache Cassandra
Discord
Akamai CDN
Maglev Load Balancer
Chapter 6: Design a Key-Value Store
Introduction
A key-value store is a type of non-relational database where data is stored as key-value pairs. Each key is unique, and values are accessed using these keys. This chapter details how to design a scalable, high-availability distributed key-value store that supports operations like:
put(key, value) for inserting data.
get(key) for retrieving data.
Characteristics of the Design
Small key-value pairs (<10 KB).
Supports big data with high availability and scalability.
Automatic scaling and tunable consistency.
Low latency.
Single Server Key-Value Store
Implementation
Use a hash table to store key-value pairs in memory.
Optimizations:
Data compression.
Storing less frequently accessed data on disk.
Limitation
A single server's memory is limited, requiring a distributed approach for scalability.
Distributed Key-Value Store
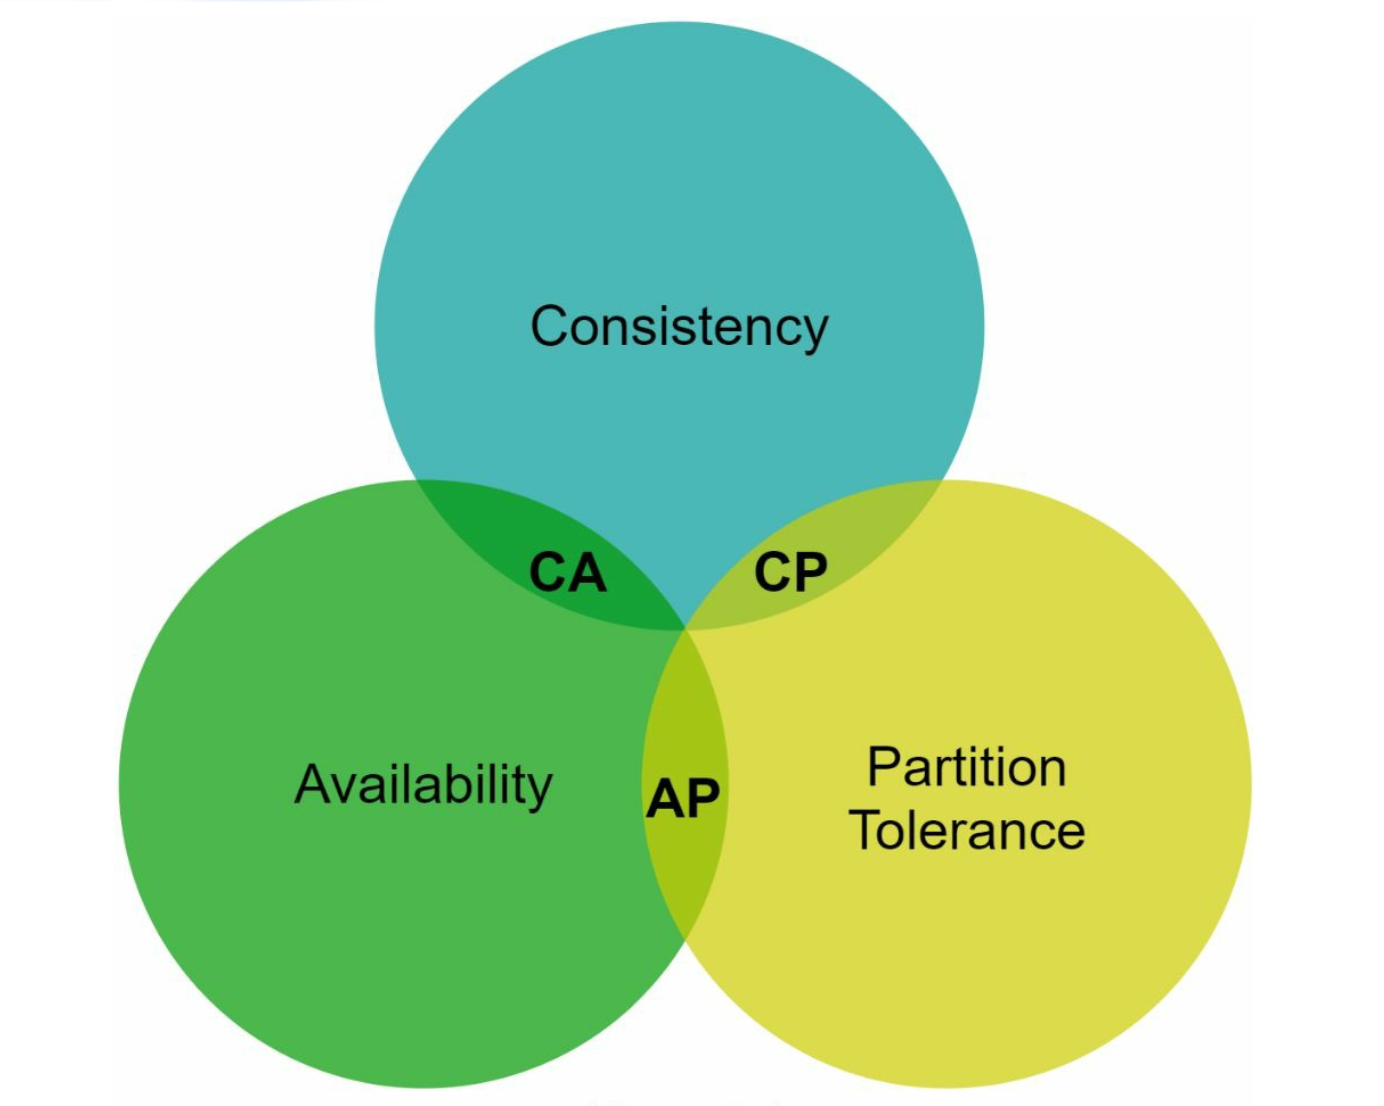
A distributed key-value store partitions data across multiple servers and must address trade-offs outlined by the CAP theorem.
CAP Theorem
Consistency: All clients see the same data simultaneously.
Availability: The system responds to every request, even if some nodes are down.
Partition Tolerance: The system continues to operate despite network partitions.
Trade-off: According to CAP theorem only two of the three guarantees can be achieved.
Redrawn · diagram-design
System Types:
CP Systems: Consistency and partition tolerance while sacrificing availability (e.g., banking systems).
AP Systems: Availability and partition tolerance while sacrificing consistency (e.g., eventual consistency).
CA Systems: Consistency and Availability while sacrificing partition tolerance.
Since network failure is unavoidable, a distributed system must tolerate network partition. Thus, a CA system cannot exist in real-world applications.
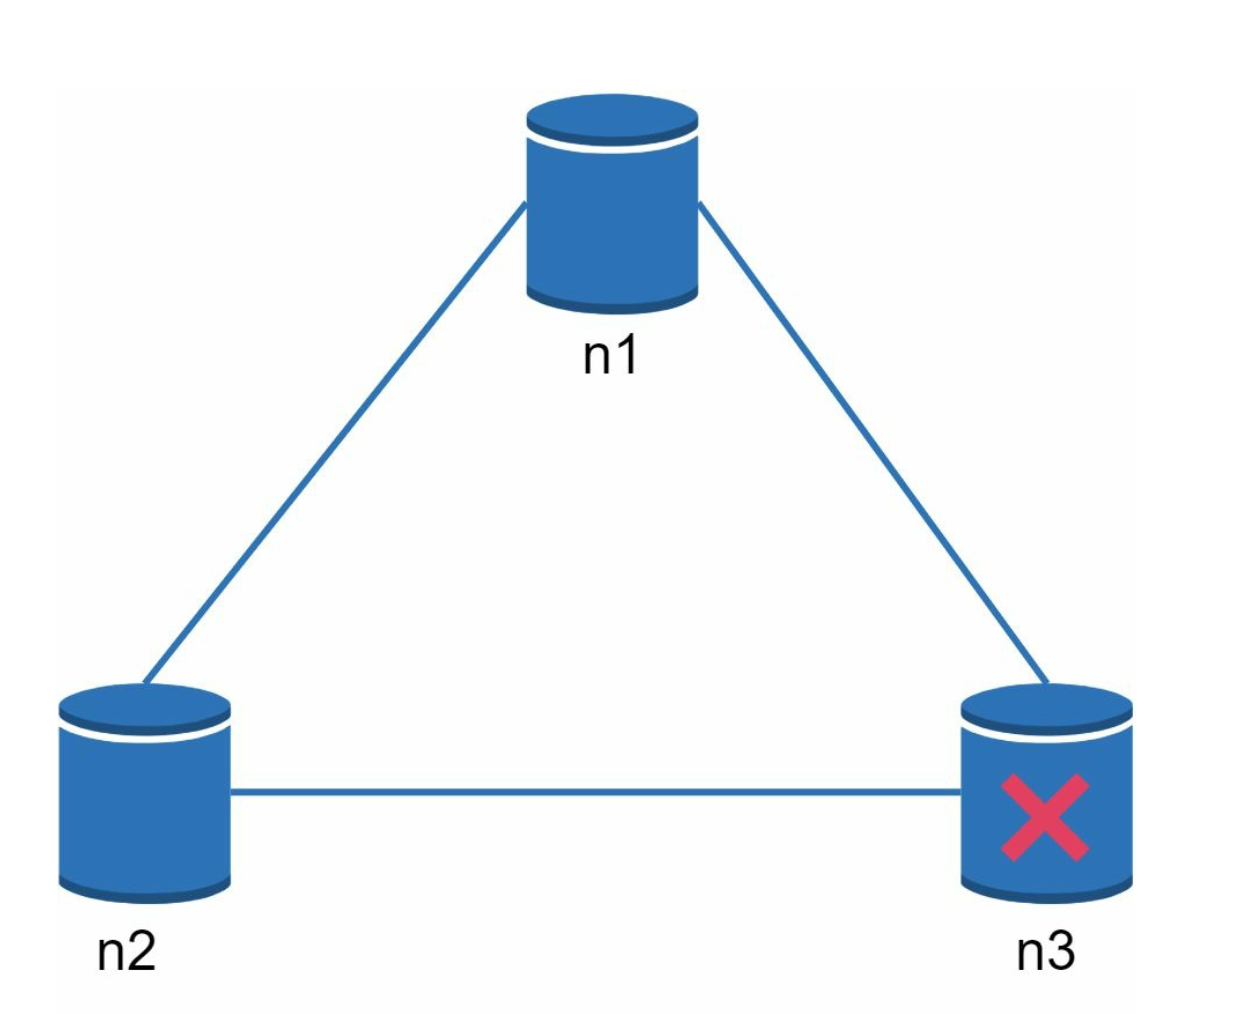
In a distributed system, partitions are inevitable. When a partition occurs, we must choose between consistency and availability. For example, if node n3 goes down,
any data written to nodes n1 or n2 cannot be propagated to n3. Conversely, if data is written to n3 but not yet propagated to n1 and n2, nodes n1 and n2 will have stale data.
Redrawn · diagram-design
If we choose CP system, we must block all write operations to n1 and n2 to avoid data inconsistency.
If we choose AP system, the system keeps accepting reads, even though it might return stale data.
For writes, n1 and n2 keep accepting writes,
and data will be synced to n3 when the network partition is resolved.
System Components
1. Data Partitioning
Technique: Consistent Hashing is used to distribute data across multiple servers evenly.
Advantages:
Automatic scaling with server addition/removal.
Heterogeneity through virtual nodes. The number of virtual nodes for a server is proportional to the server capacity.
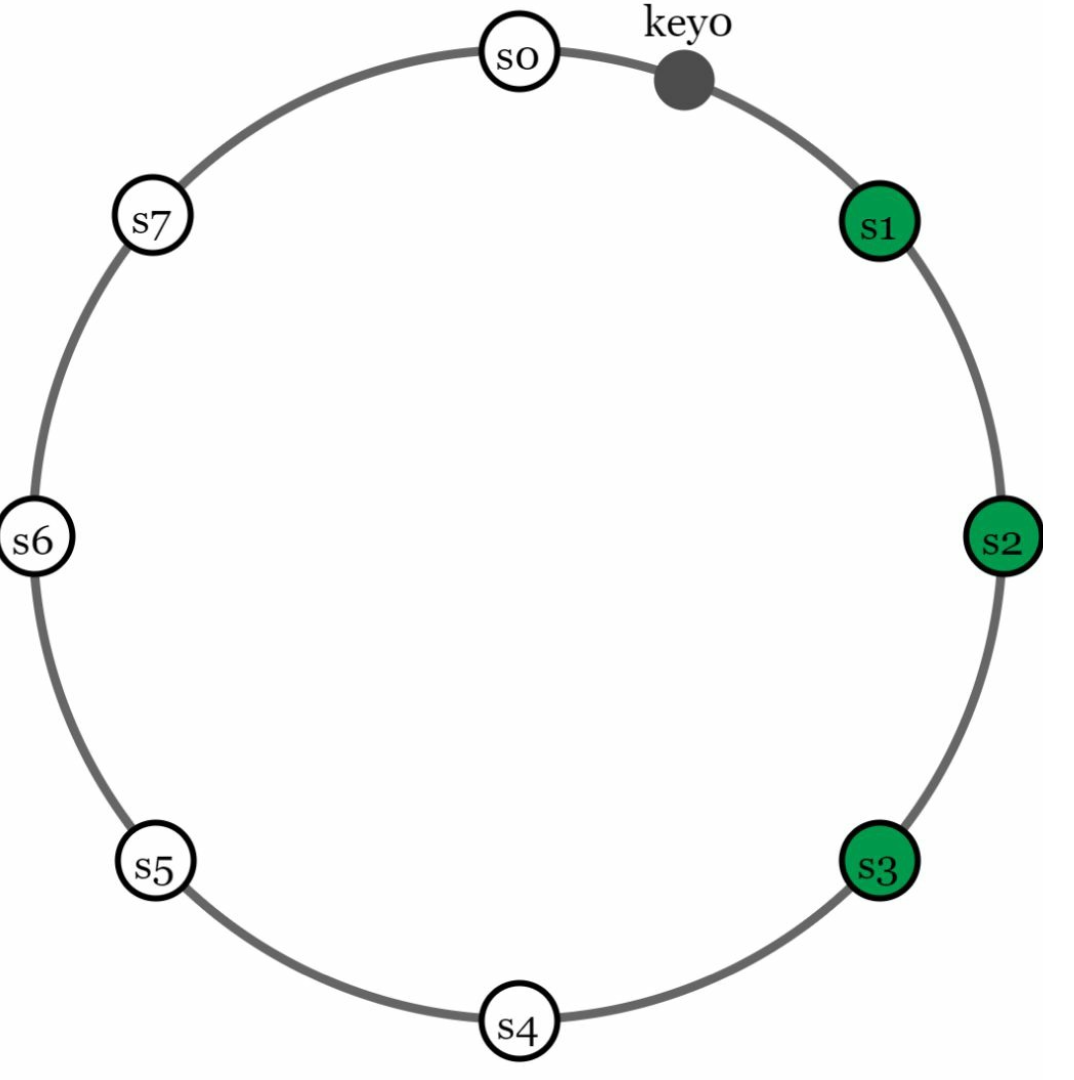
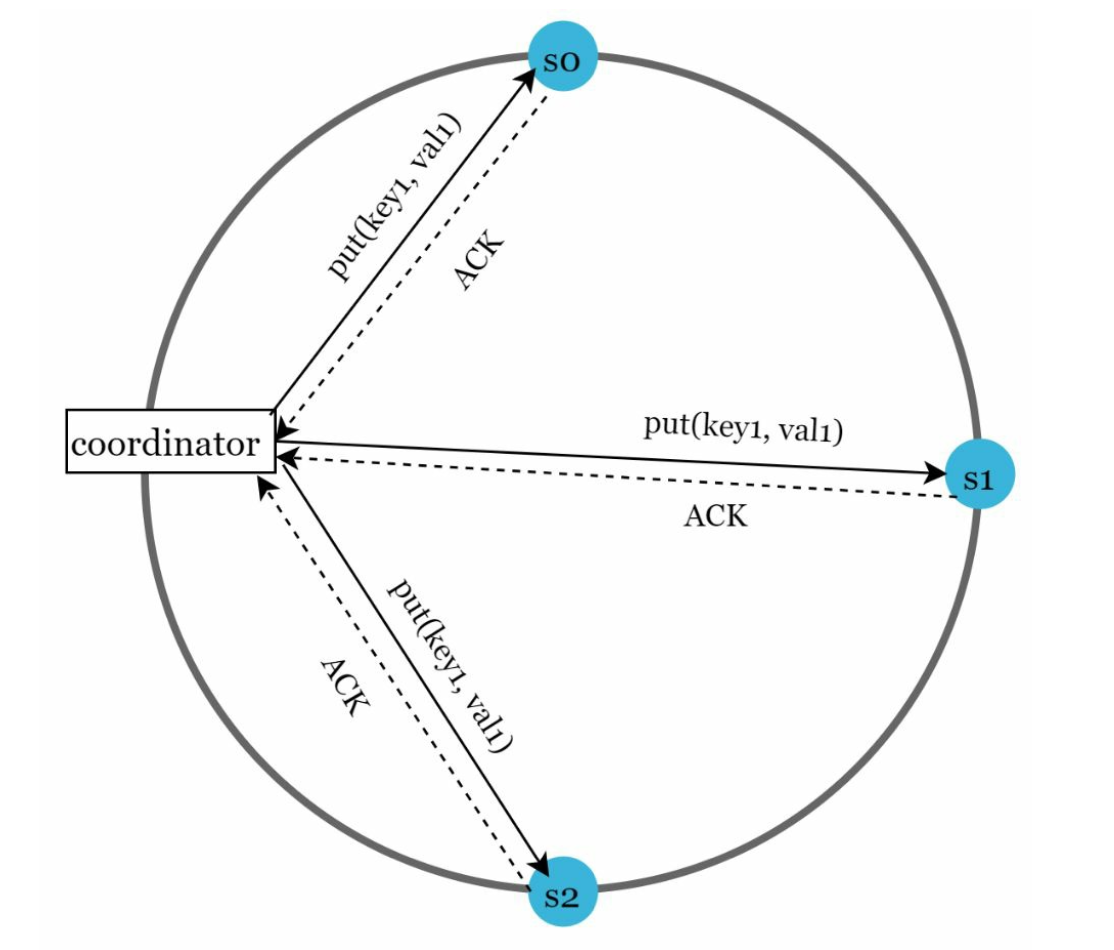
2. Data Replication
Replicate data across N servers for high availability.
The N servers are chosen by walking clockwise from the server position and choose the first N servers on the ring to store data copies.Place replicas in distinct data centers to improve reliability in case of virtual nodes.
Redrawn · diagram-design
3. Consistency
Since data is replicated at multiple nodes, it must be synchronized across replicas.
Quorum Consensus:
N: Total replicas.
W: Write quorum size. For a write to be considered successful, write must be acknowledged from W replicas.
R: Read quorum size. For a read to be considered as successful, read must wait for responses from at least R replicas.
Rule:W + R > N ensures strong consistency.
The configuration of W, R and N is a typical tradeoff between latency and consistency.
Redrawn · diagram-design
If R = 1 and W = N, the system is optimized for a fast read.
If W = 1 and R = N, the system is optimized for fast write.
If W + R > N, strong consistency is guaranteed (Usually N = 3, W = R = 2).
If W + R <= N, strong consistency is not guaranteed.
Models:
Strong Consistency: A read operation returns a value corresponding to the result of the most updated write data item.
Weak Consistency: Subsequent read operations may not see the most updated value.
Eventual Consistency: Given enough time, all updates are propagated, and all replicas are consisten
4. Inconsistency Resolution
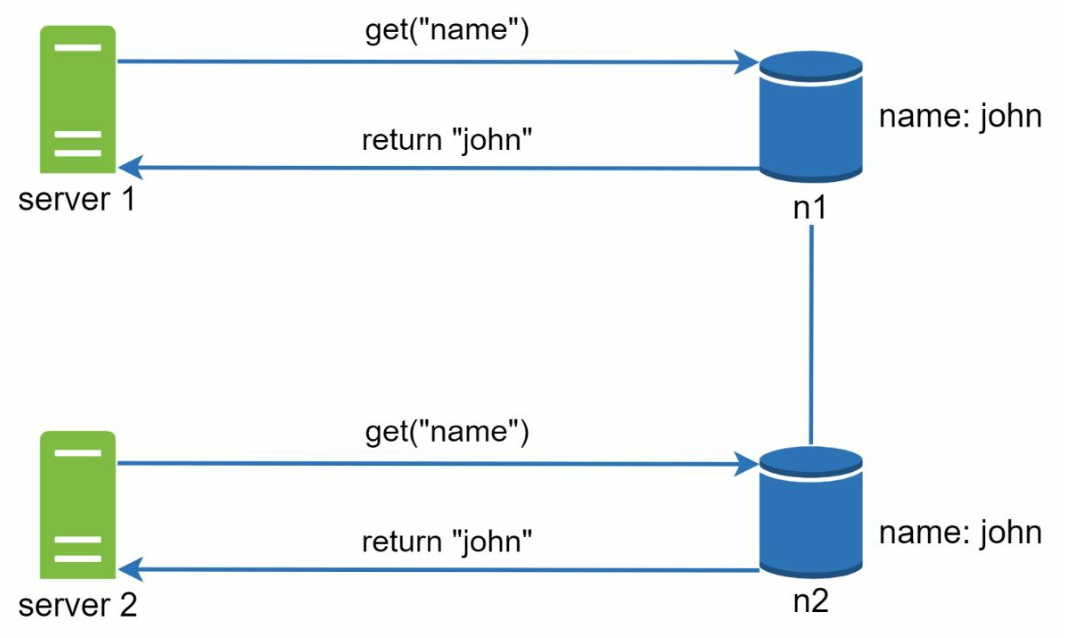
Replication gives high availability but causes inconsistencies among replicas. Versioning and
vector locks are used to solve inconsistency problems.
Versioning:
Use vector clocks to track data versions and resolve conflicts.
Versioning means treating each data modification as a new immutable version of data.
Redrawn · diagram-design
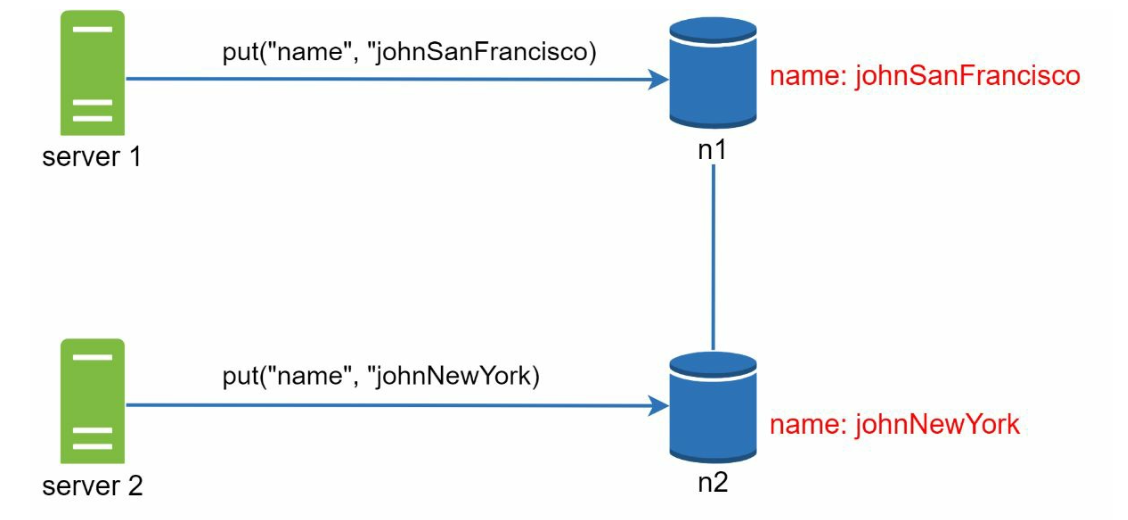
Redrawn · diagram-design
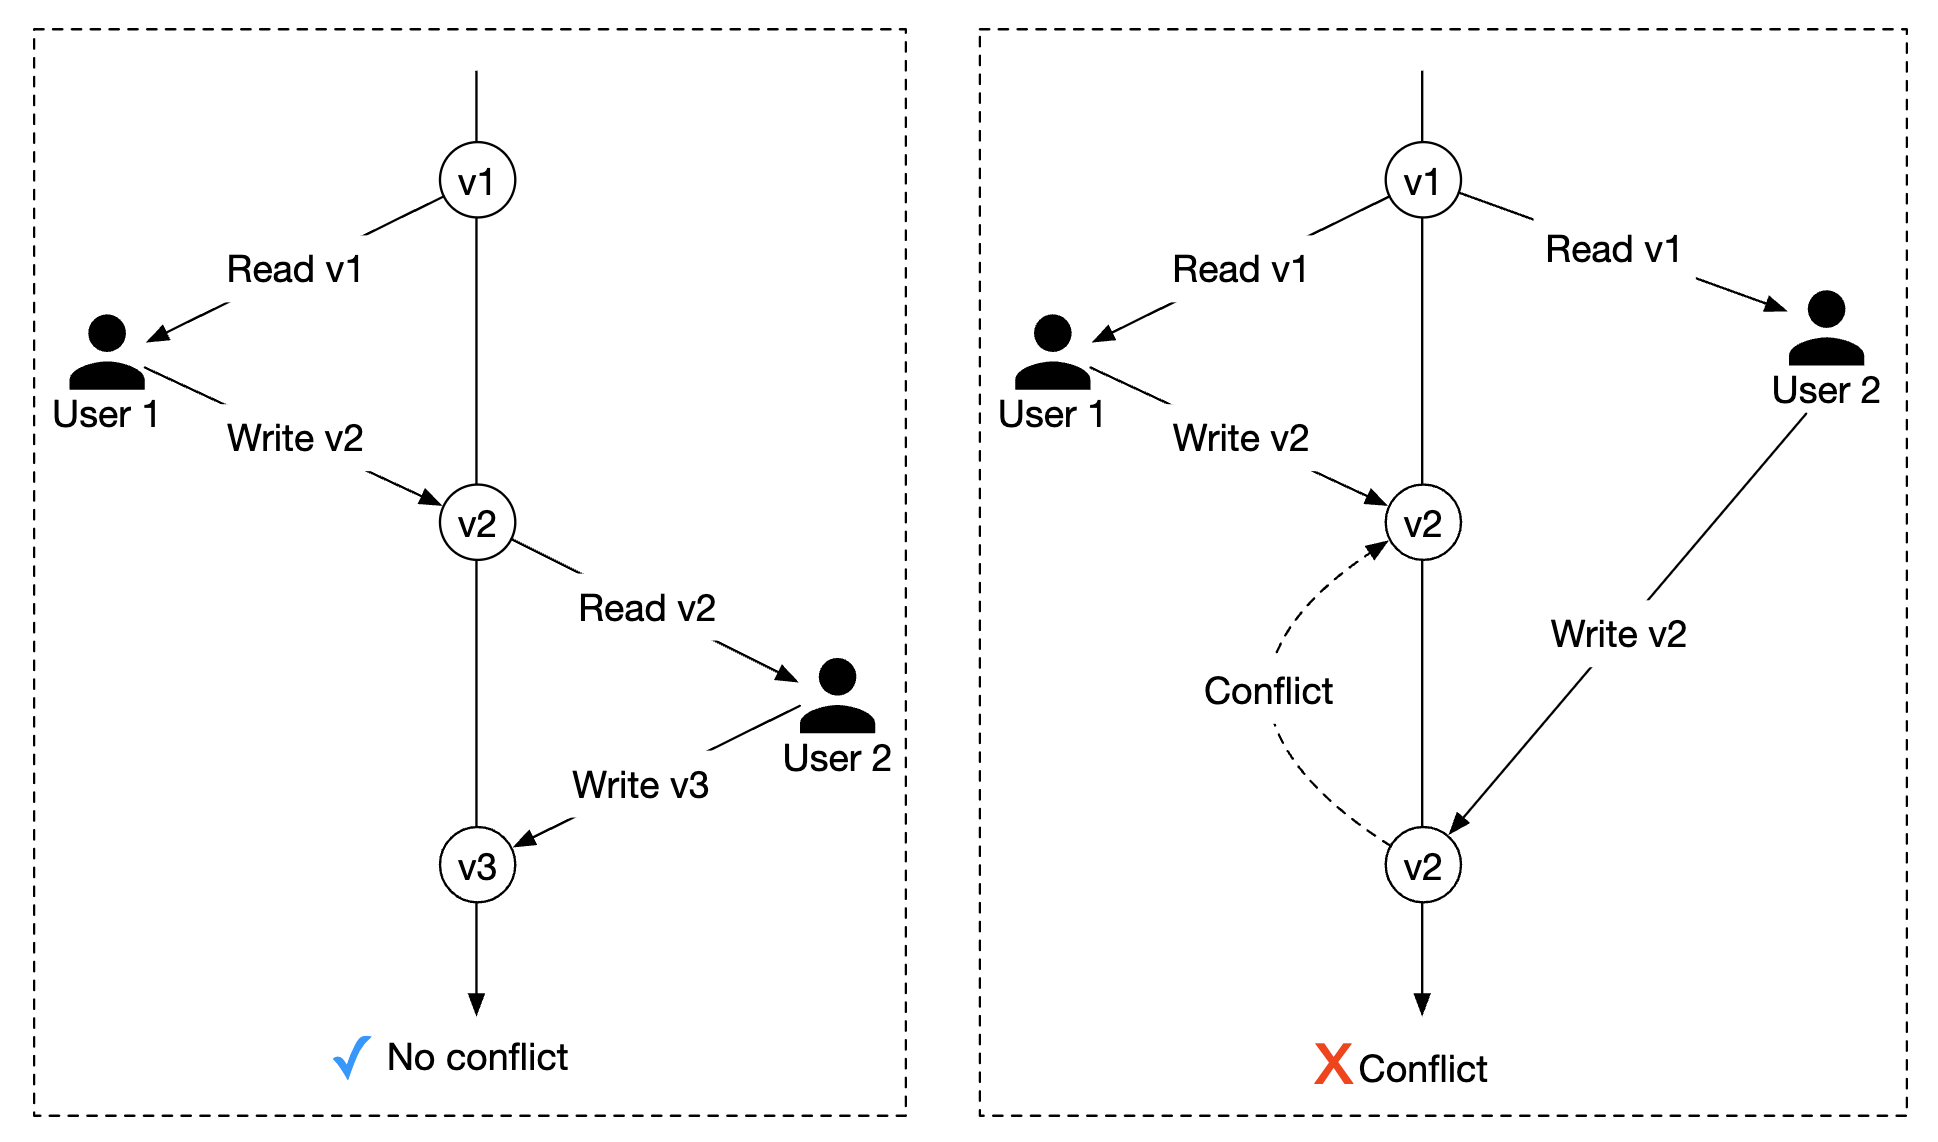
Server 1 changes the name , and server 2 also changes the name. These two changes are performed simultaneously. Now, we have conflicting values, called versions v1 and v2.
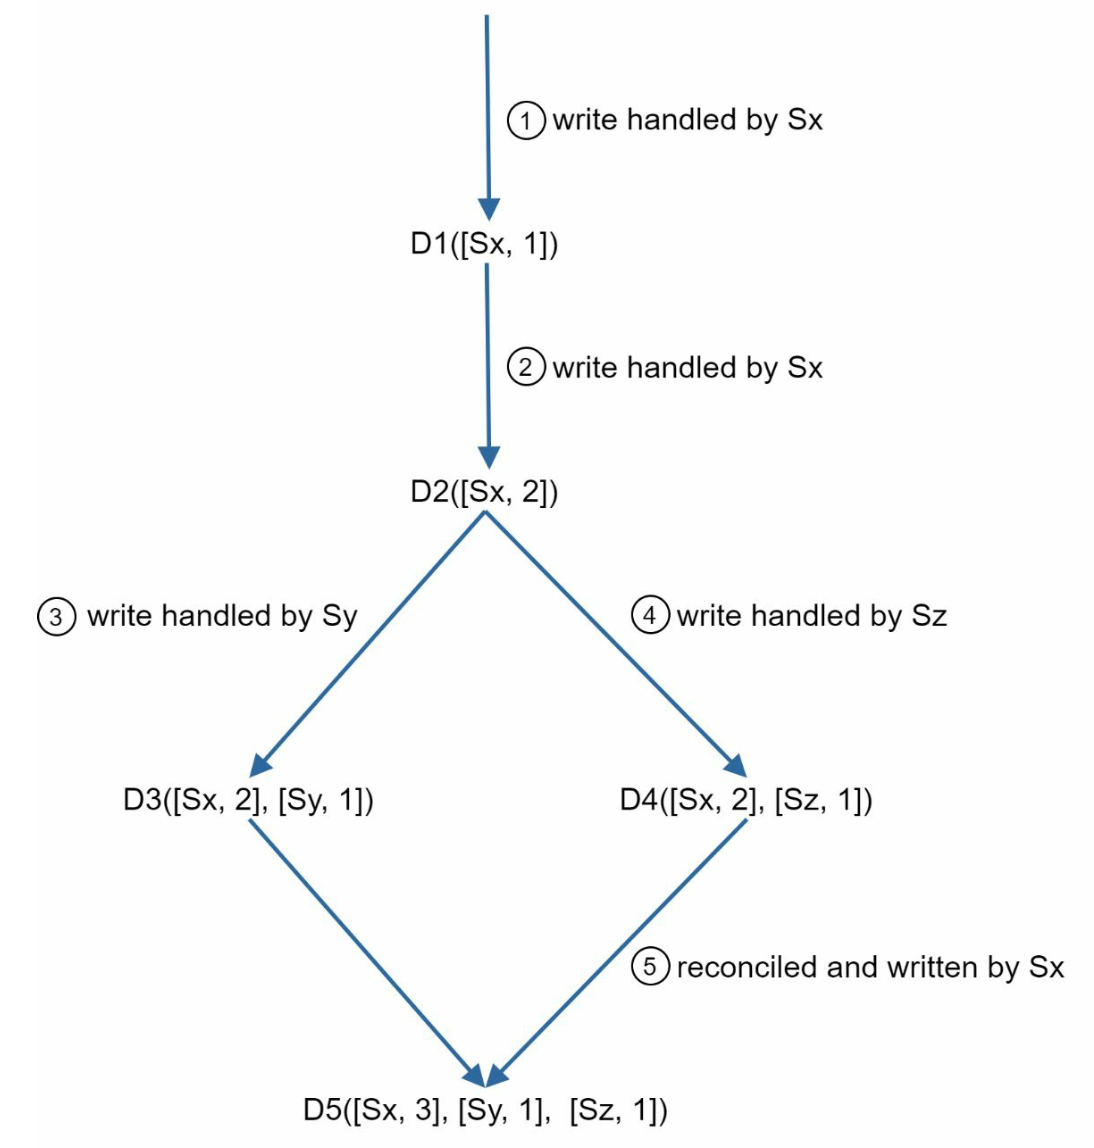
Vector Clock
Setup: A vector clock is a [server, version] pair associated with a data item. It can be used to check
if one version precedes, succeeds, or in conflict with others.
Assume a vector clock represented by D([S1, v1], [S2, v2], …, [Sn, vn]), If data item D is written to server
Si, the system must perform one of the following tasks.
Where: D is the data item.Si is the server identifier.vi is the version counter for the data at server Si.
Updating the Vector Clock: When a data item is modified at a server:
If the server exists in the vector clock, its version counter is incremented.
Otherwise, a new entry is added to the vector clock.
Conflict Detection:
No Conflict: A version X is an ancestor of version Y if all counters in X are less than or equal to those in Y.
Conflict Exists: Two versions are siblings if there is at least one counter in Y that is less than its counterpart in X.
Conflict Resolution: When conflicts are detected (sibling versions), the system relies on application-specific logic or client intervention to reconcile the data.
Redrawn · diagram-design
Challenges:
Increased complexity for clients.
Vector clock size may grow with many updates, requiring trimming strategies to limit its size.
5. Handling Failures
a. Failure Detection
It is insufficient to believe that a server is down because another server says so.Usually, it requires at least two independent sources of information to mark a server down.
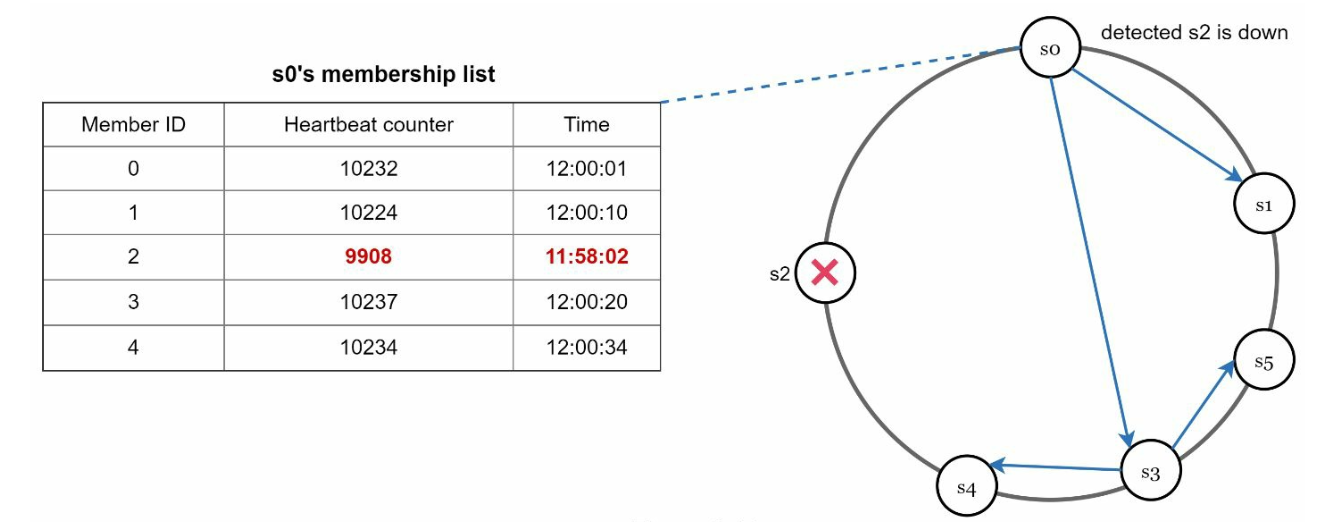
Gossip Protocol:
Redrawn · diagram-design
Each node maintains member IDs and heartbeat counters.
Each node periodically increments its heartbeat counter.
Each node periodically sends heartbeats to a set of random nodes.
If the heartbeat has not increased for more than predefined periods, the member is
considered as offline
b. Temporary Failures
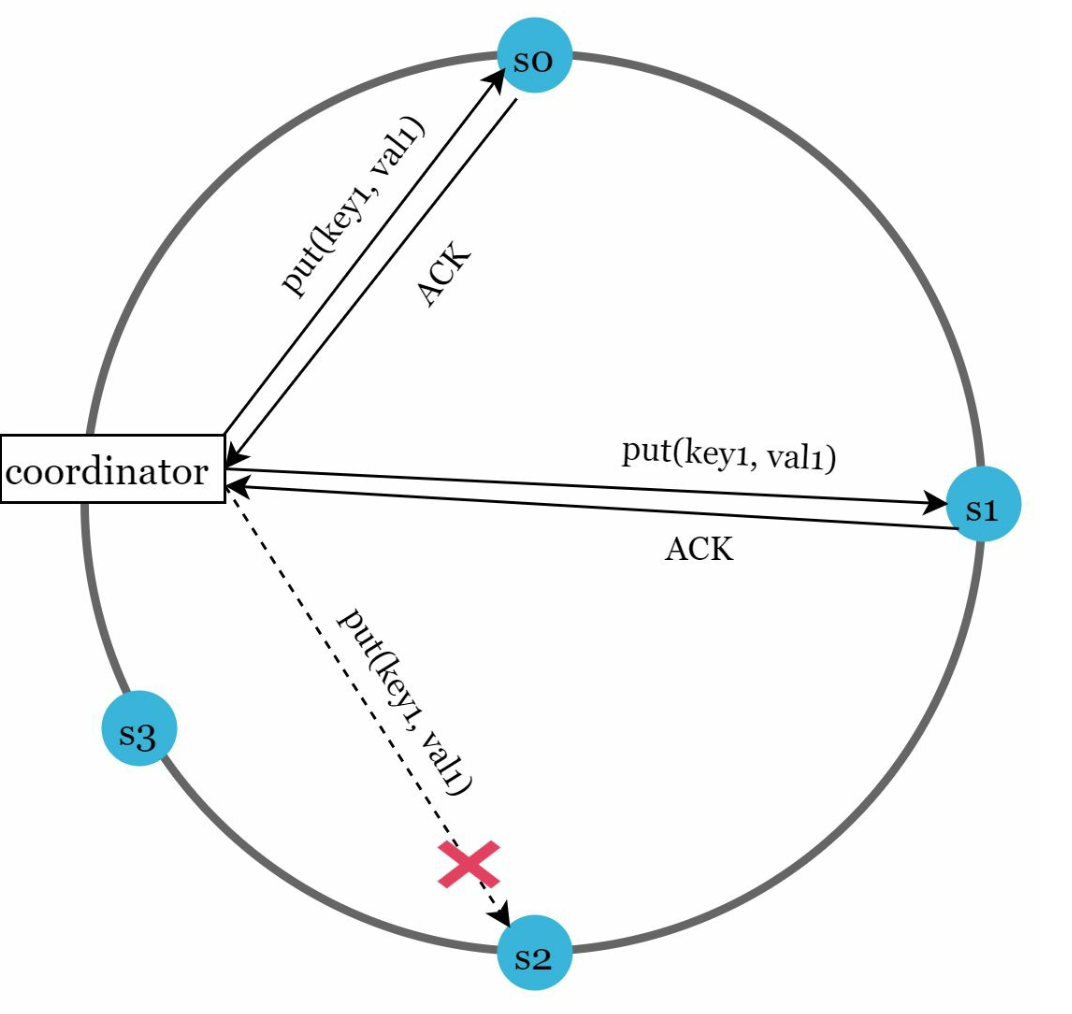
Sloppy Quorum: Use healthy nodes to maintain operations temporarily.
Redrawn · diagram-design
After detecting failures, the system needs to deploy certain mechanisms to ensure availability
Instead of enforcing the quorum requirement, the system chooses the first W healthy servers for writes and first R
healthy servers for reads on the hash ring.
Offline servers are ignored. If a server is unavailable, another server will process requests temporarily
Hinted Handoff: Offline servers catch up with changes upon recovery.
When the down server is up, changes will be pushed back to achieve data consistency
c. Permanent Failures
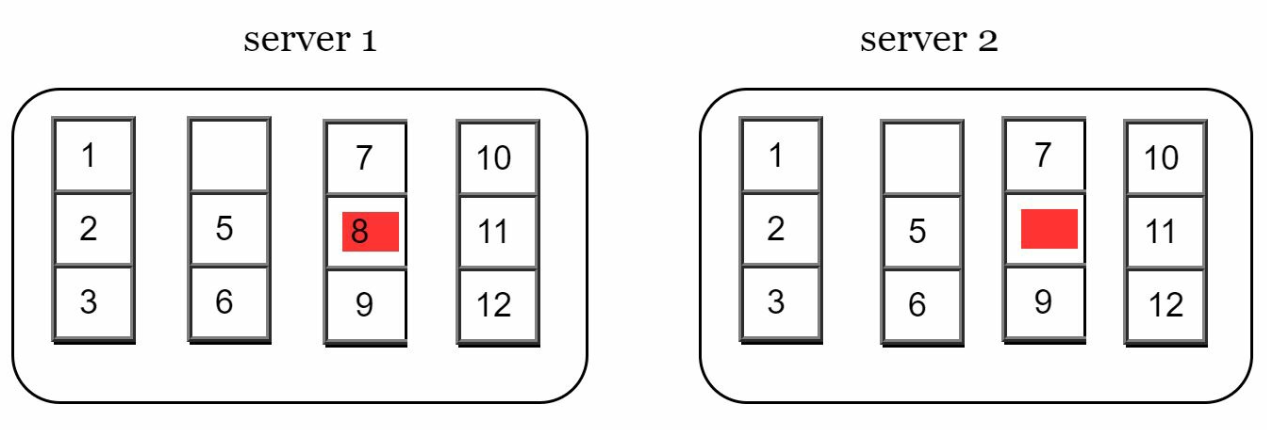
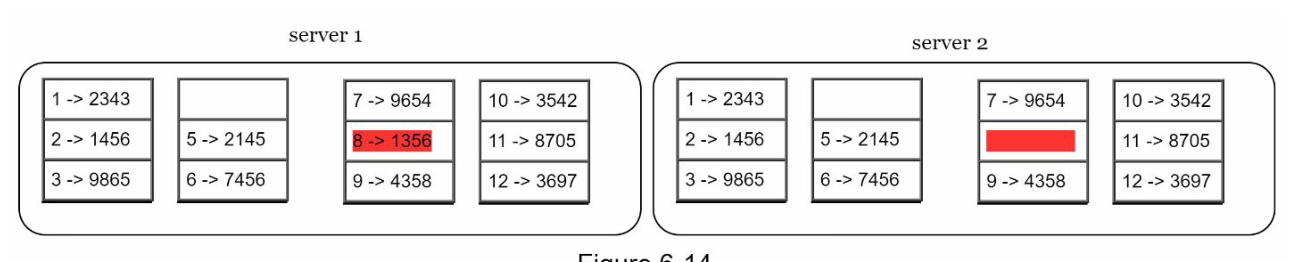
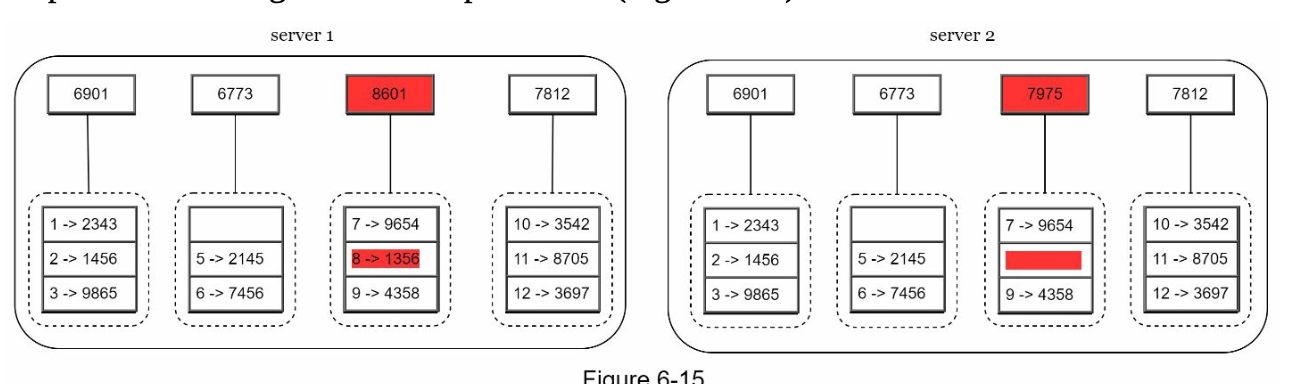
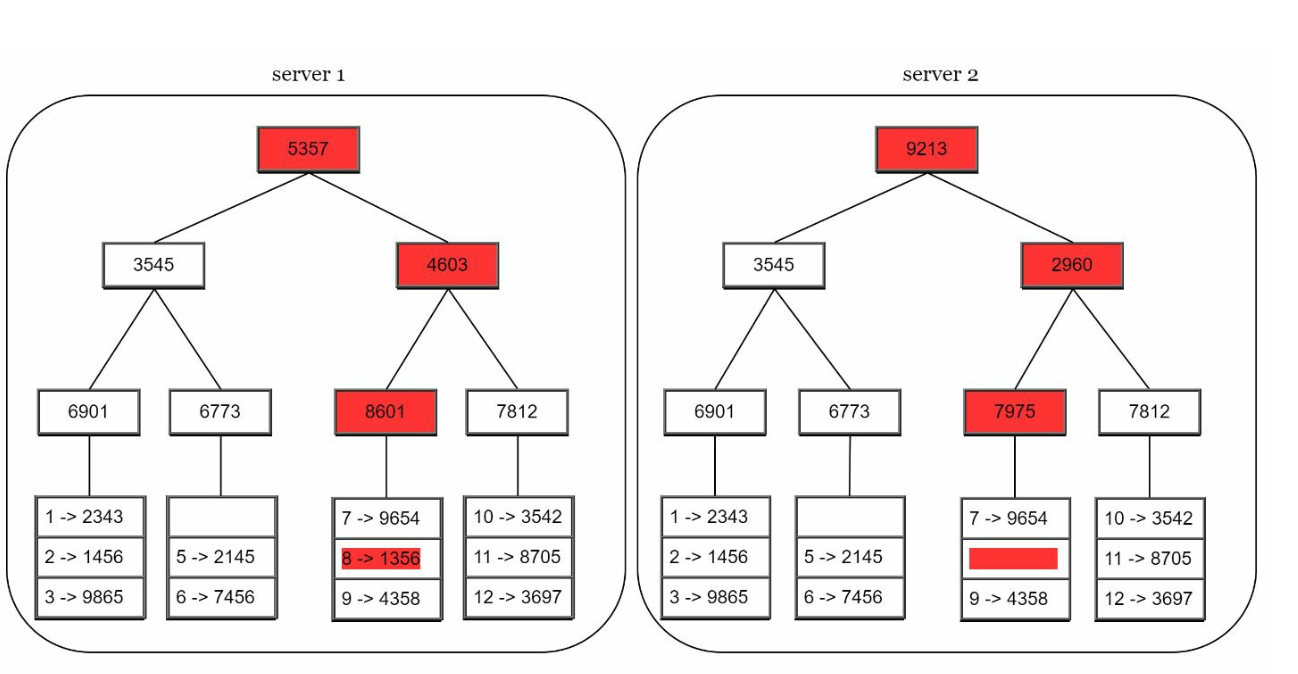
Use Merkle Trees for efficient synchronization between replicas.
A Merkle Tree (or hash tree) is a data structure to efficiently detect and resolve inconsistencies between replicas during permanent failures.
Working
Structure:
Leaf Nodes store the hash of individual data blocks.
Non-Leaf Nodes store the hash of their child nodes.
The root hash represents the combined state of all data in the tree.
Building a Merkle Tree:
Step 1: Divide the key space into buckets.
Redrawn · diagram-design
Step 2: Hash each key in a bucket using uniform hashing.
Redrawn · diagram-design
Step 3: Create a single hash for each bucket.
Redrawn · diagram-design
Step 4: Combine hashes of buckets to compute higher-level hashes, culminating in the root hash.
Redrawn · diagram-design
Synchronization:
To synchronize two replicas:
Compare their root hashes.
If the root hashes match, the replicas are consistent.
If the root hashes differ, compare child hashes recursively to identify inconsistent buckets.
Only the inconsistent data is synchronized.
Advantages
Efficiency: Only inconsistent data is synchronized, reducing data transfer.
Scalability: Effective for large datasets with minimal synchronization overhead.
Reliability: Ensures data consistency across replicas.
6. Handling Data Center Outages
Replicate data across multiple data centers to ensure availability during outages.
Write and Read Paths
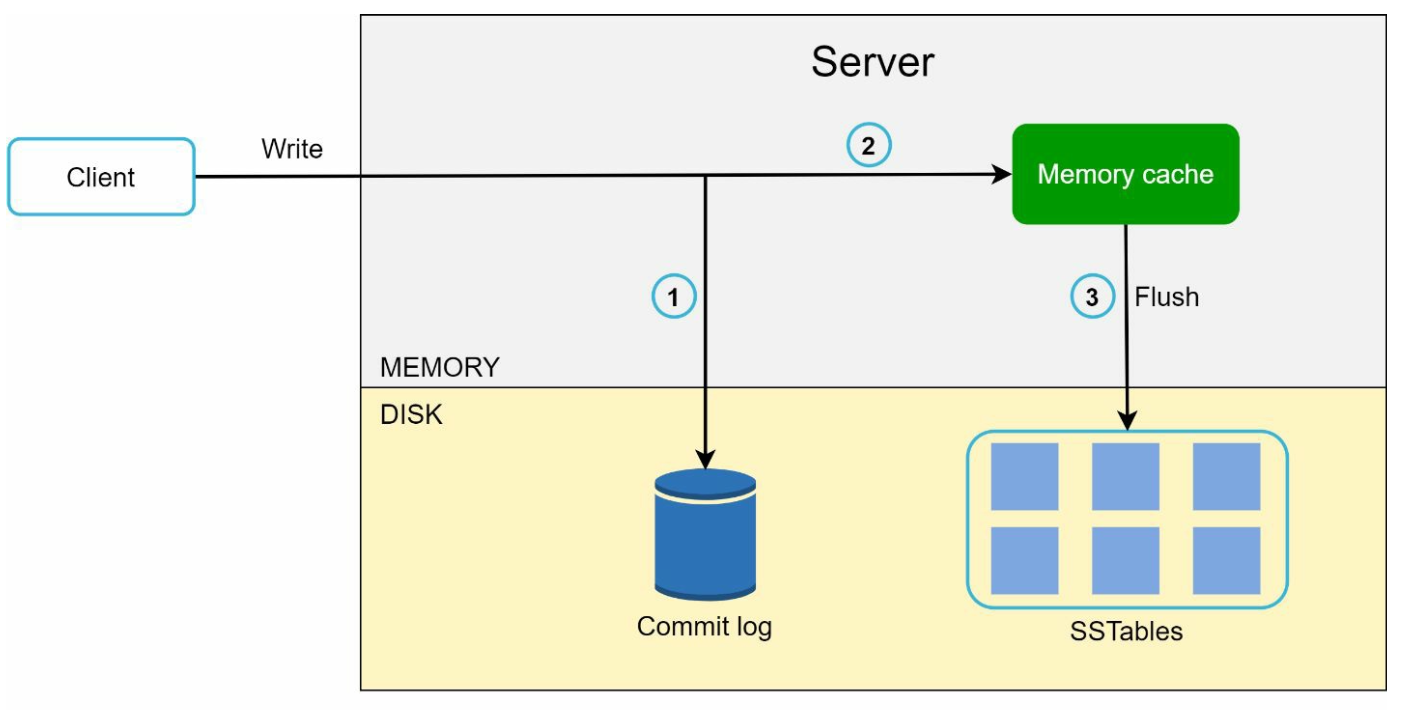
1. Write Path (Based on Cassandra architecture)
Redrawn · diagram-design
Persist the write in a commit log.
Save data to a memory cache.
Flush data to SSTable (Sorted String Table) on disk when cache is full.
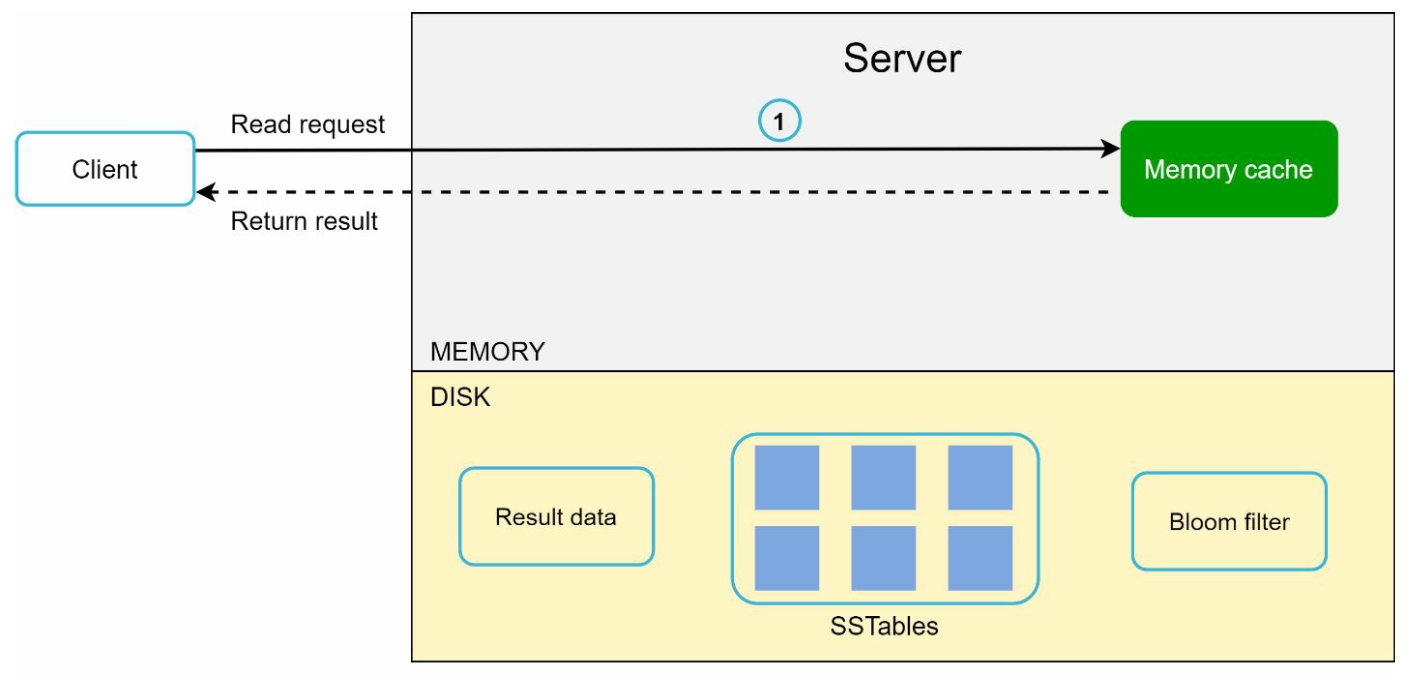
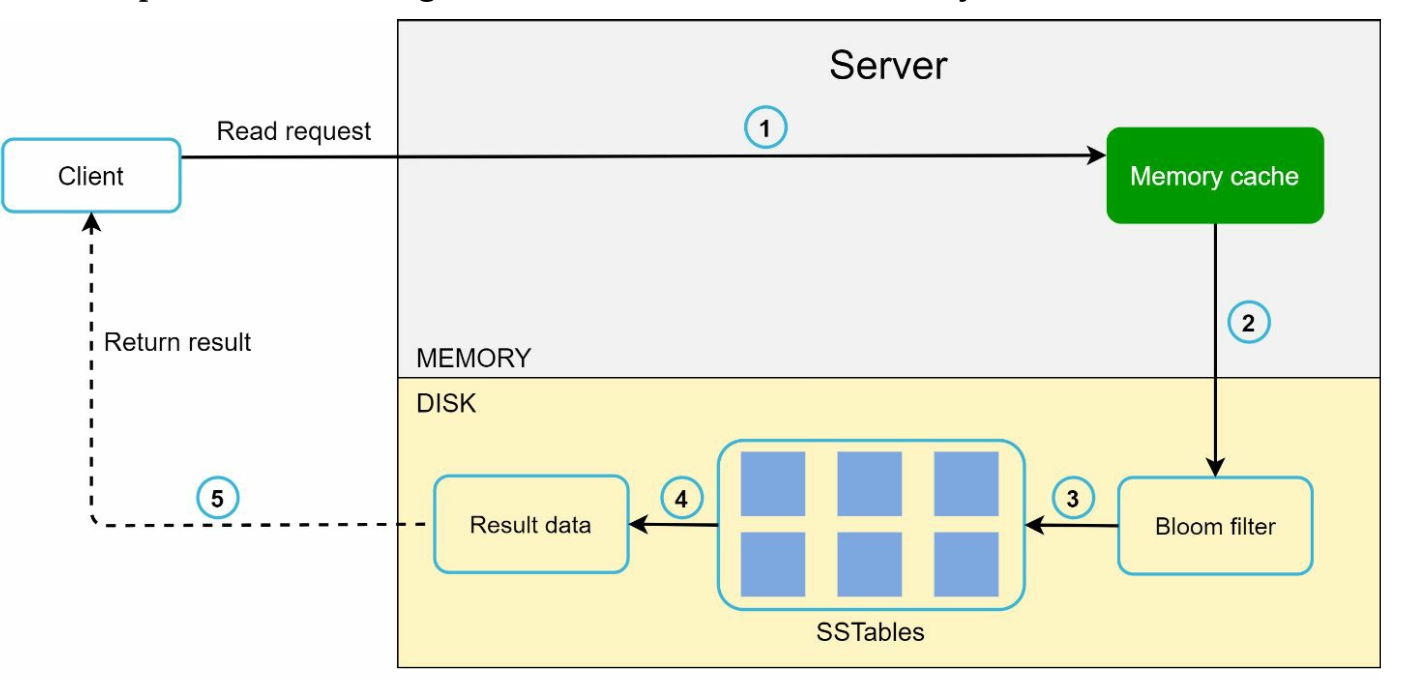
2. Read Path
Redrawn · diagram-design
Redrawn · diagram-design
Check memory cache for the data.
If absent, use a Bloom Filter to locate the data in SSTables.
Retrieve and return the data.
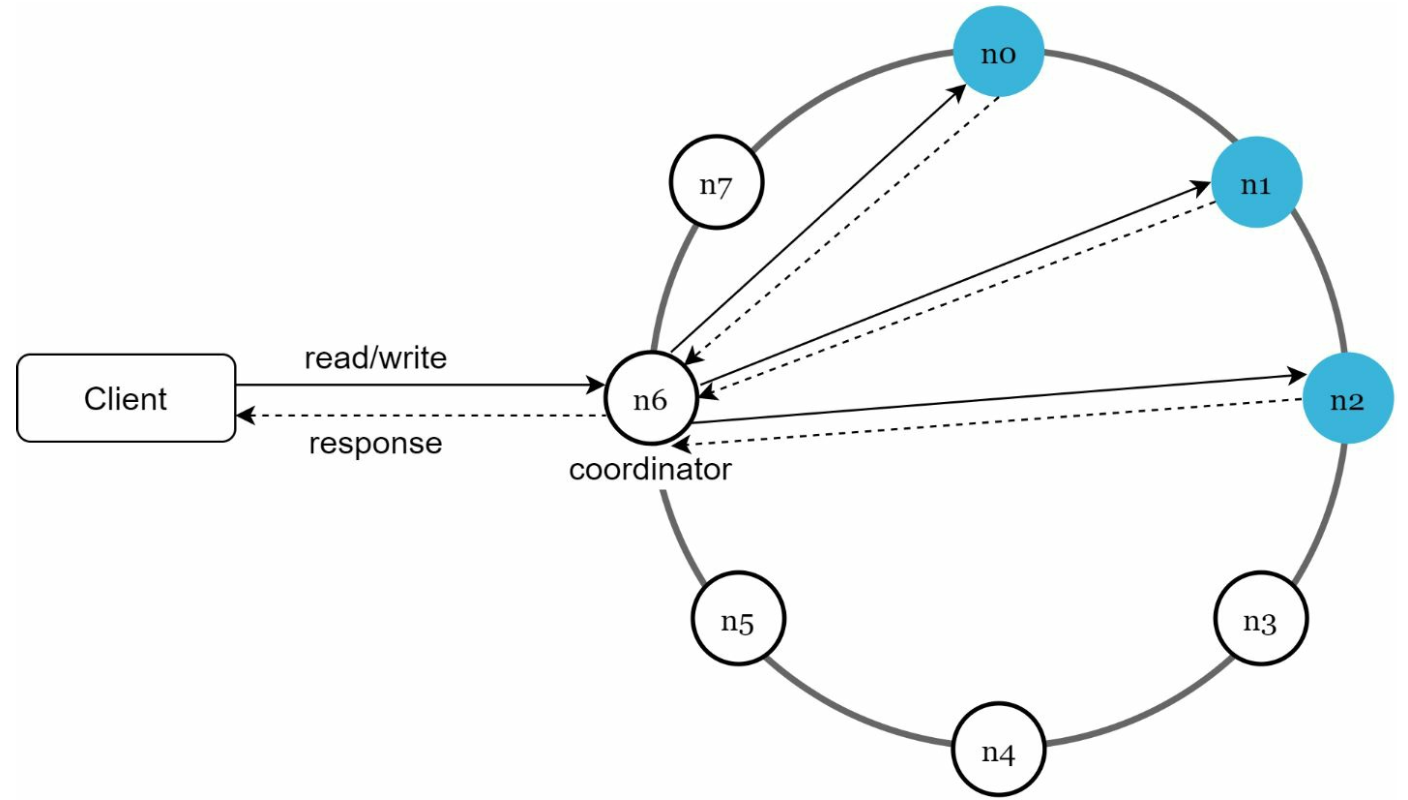
Final Architecture
Redrawn · diagram-design
Clients communicate with the key-value store through simple APIs: get(key) and put(key,
value).
A coordinator is a node that acts as a proxy between the client and the key-value store.
Nodes are distributed on a ring using consistent hashing.
The system is completely decentralized so adding and moving nodes can be automatic.
Data is replicated at multiple nodes.
There is no single point of failure as every node has the same set of responsibilities.
Chapter 7: Design a Unique ID Generator in Distributed Systems
Introduction
This chapter addresses the challenge of designing a unique ID generator for distributed systems. Traditional auto-increment keys are unsuitable in distributed environments due to scalability and synchronization challenges. The focus is on creating unique, sortable, 64-bit numerical IDs that meet the following requirements:
IDs must be unique and ordered by date.
IDs must fit within 64 bits.
The system should generate over 10,000 IDs per second.
Step 1: Understanding the Problem
Basic Requirements
IDs must be unique and numerical and should fit in 64 bits.
IDs increment with time but not strictly by +1.
IDs should be sortable by date.
System must handle high throughput (10,000 IDs/sec).
Step 2: High-Level Design Options
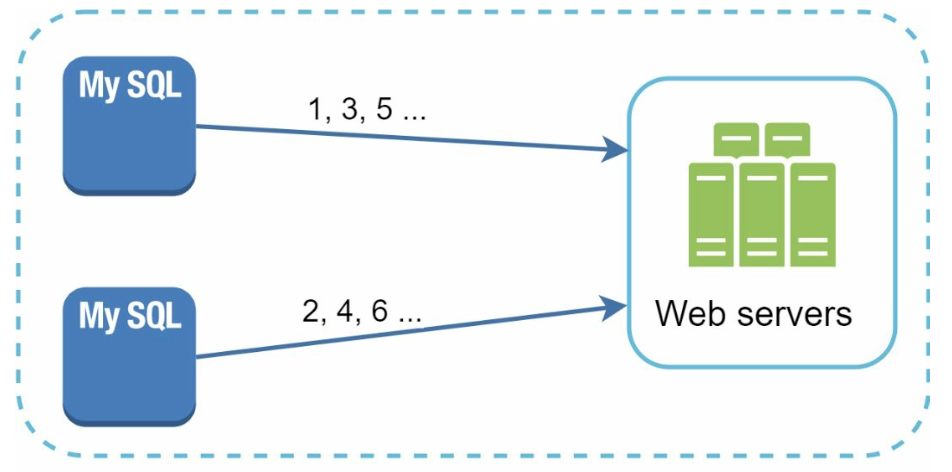
1. Multi-Master Replication
Approach: Use database auto_increment with step increments (e.g., +k for k servers).
Redrawn · diagram-design
Drawbacks:
Hard to scale across data centers.
IDs do not always increase with time.
Scaling issues when servers are added/removed.
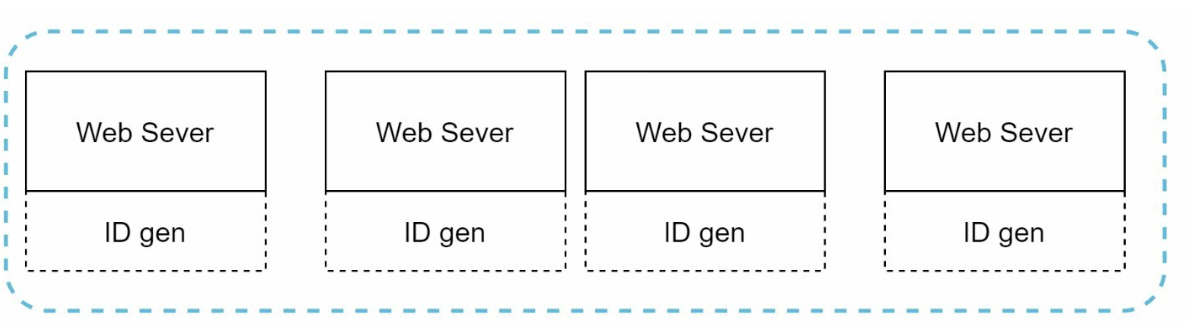
2. UUID (Universally Unique Identifier)
Approach:
Generate 128-bit unique identifiers independently on each server using UUID.
UUIDs can be generated independently without coordination between servers
Redrawn · diagram-design
Advantages:
No coordination needed between servers.
Scales easily with web servers.
Drawbacks:
Exceeds 64-bit requirement.
IDs are not sortable by time and may be non-numeric.
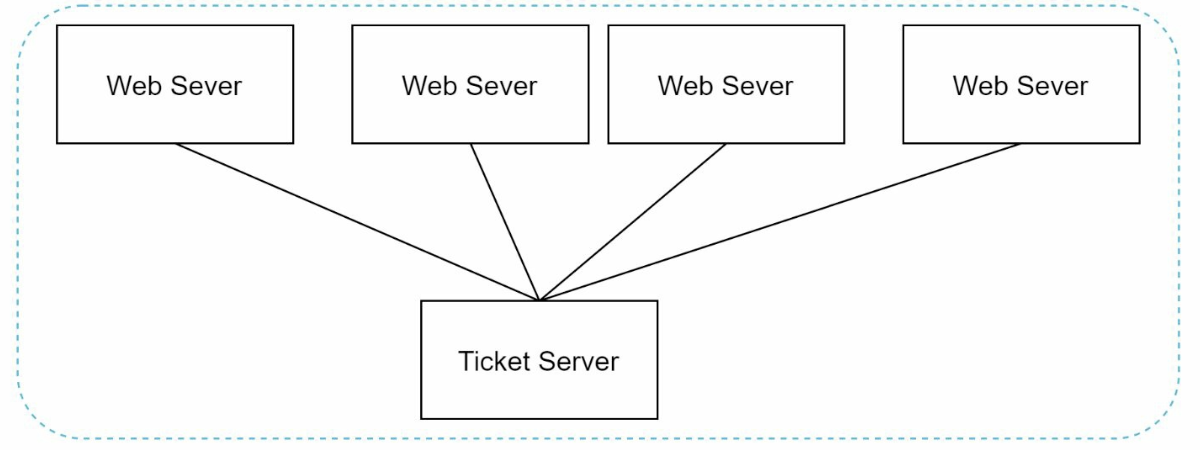
3. Ticket Server
Approach: Use a centralized database server to increment and assign IDs.
Redrawn · diagram-design
Advantages:
Simple to implement for small-scale systems.
Generates numeric IDs.
Drawbacks:
Single point of failure.
Synchronization challenges in multi-server setups.
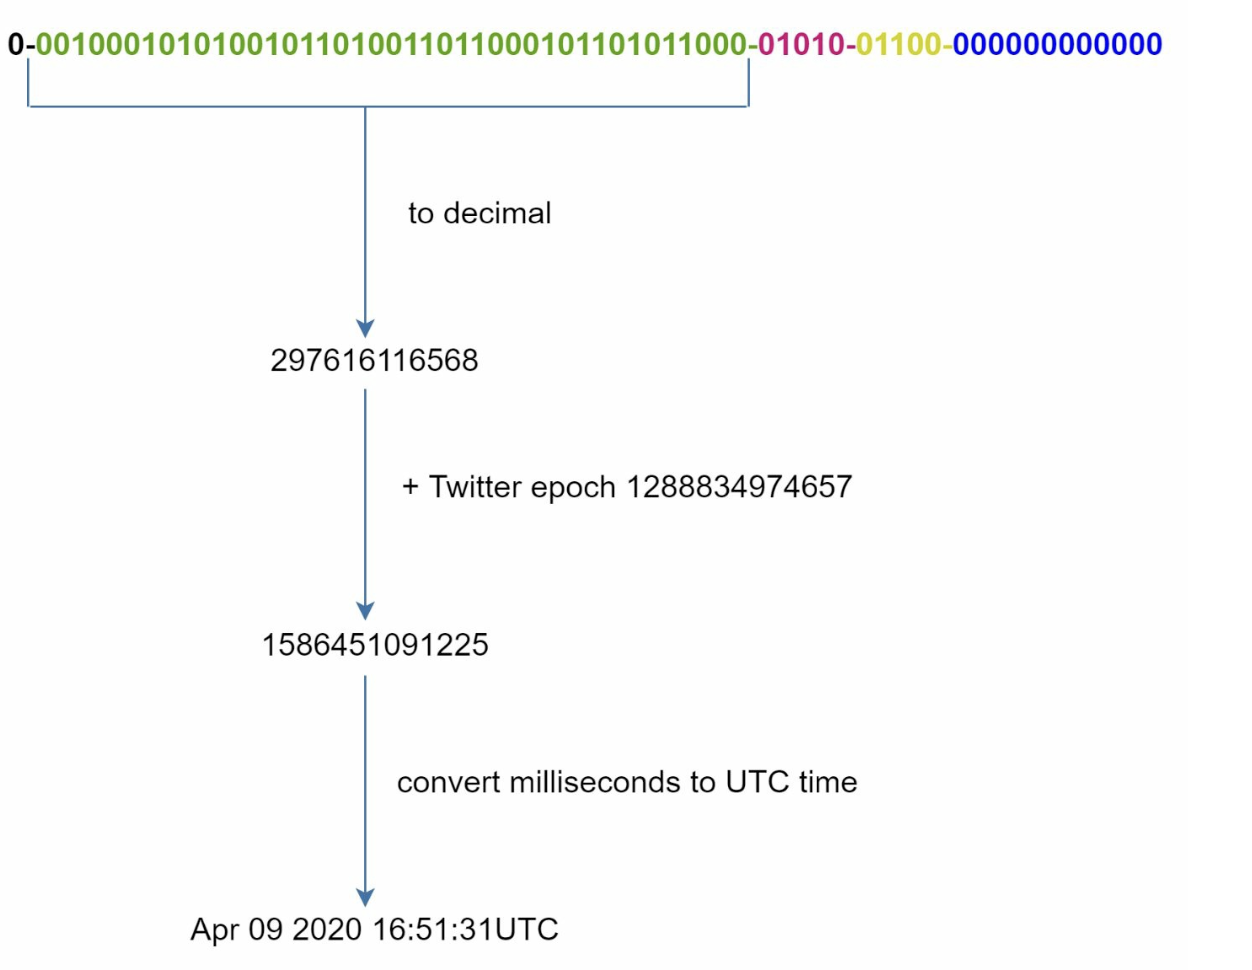
4. Twitter Snowflake Approach
Approach:
Redrawn · diagram-design
Redrawn · diagram-design
Divide IDs into sections to ensure uniqueness and scalability.
Sign Bit (1 bit): Always 0, potentially distinguishing signed and unsigned numbers.
Timestamp (41 bits): Milliseconds since a custom epoch (Twitter's default is 1288834974657, equivalent to Nov 04, 2010, 01:42:54 UTC). Ensures IDs are time-ordered.
Datacenter ID (5 bits): Identifies up to 2^5 = 32 datacenters.
Machine ID (5 bits): Identifies up to 2^5 = 32 machines within each datacenter.
Sequence Number (12 bits): Tracks IDs generated on a machine within the same millisecond, supporting up to 2^12 = 4096 IDs per millisecond. The sequence resets to 0 every millisecond.
Advantages:
Scalability: Handles 10,000+ IDs per second across multiple servers.
Time-Order: Ensures IDs are sortable by time.
Decentralization: No single point of failure.
Step 4: Additional Considerations
1. Clock Synchronization
Challenge: ID generation assumes synchronized clocks across servers.
Solution: Use Network Time Protocol (NTP) to minimize drift.
2. Section Length Tuning
Adjust section sizes (e.g., fewer sequence bits, more timestamp bits) based on use case.
3. High Availability
ID generators are mission-critical and must be fault-tolerant.
Consider redundancy and failover mechanisms.
Chapter 8: Design a URL Shortener
Introduction
This chapter discusses the design of a URL shortening service like TinyURL. The system's main goals include URL shortening, redirecting, and high scalability to handle large traffic volumes.
Requirements
Shortened URLs must be unique and as short as possible.
Handle 100 million URL generations per day with a 10-year support capacity.
Support efficient read operations with a 10:1 read-to-write ratio.
Store 365 billion records, requiring approximately 365 TB of storage over 10 years.
Step 1: High-Level Design
API Endpoints
URL Shortening:
Endpoint: POST api/v1/data/shorten
Parameters: {longUrl: longURLString}
Returns: shortURL
URL Redirecting:
Endpoint: GET api/v1/shortUrl
Returns: longURL for redirection.
Redrawn · diagram-design
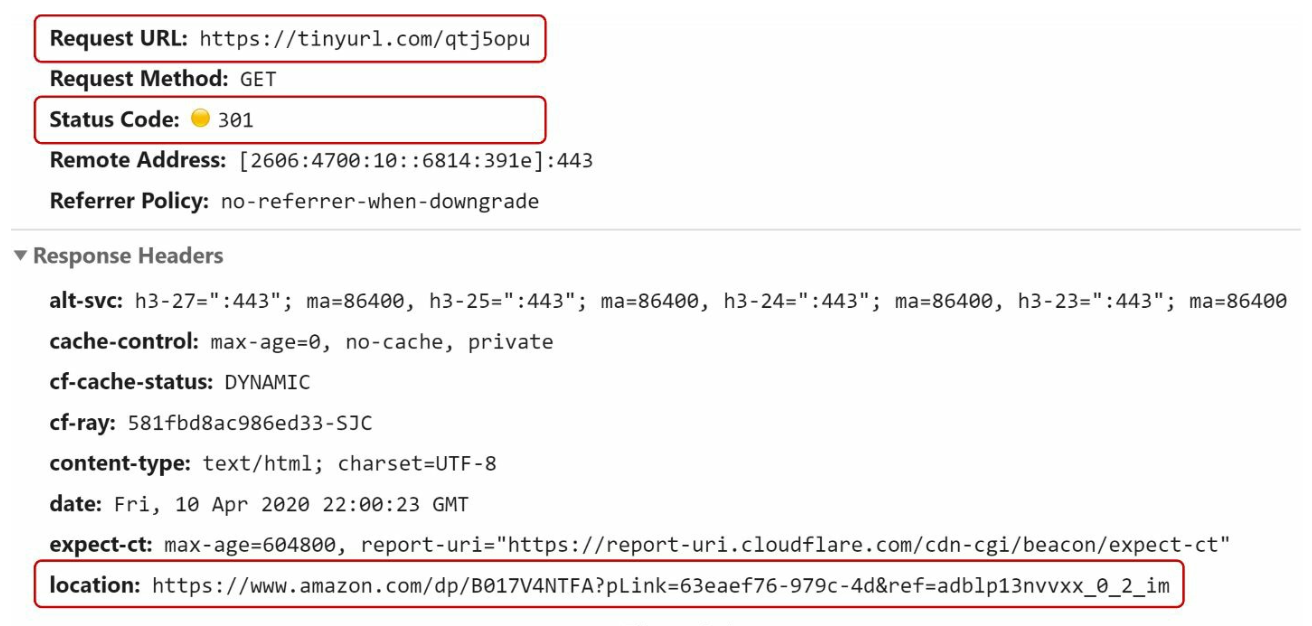
URL Redirection
301 Redirect: A 301 redirect shows that the requested URL is “permanently” moved to the long URL. The browser caches the response, and
subsequent requests for the same URL will not be sent to the URL shortening service.
302 Redirect: Temporary; useful for analytics like tracking clicks.
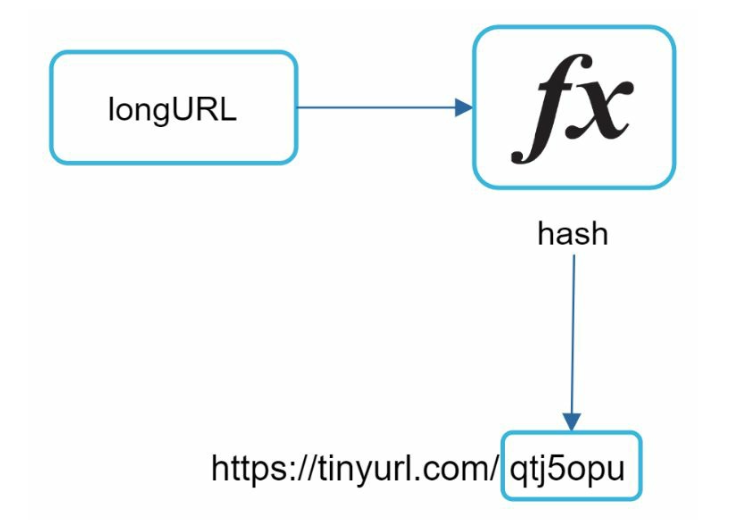
URL Shortening
Redrawn · diagram-design
Use a hash function to generate a short URL, mapping long URLs to unique shortened versions.
The hash function must satisfy the following requirements:
Each longURL must be hashed to one hashValue.
Each hashValue can be mapped back to the longURL.
Step 2: Deep Dive into Design
Data Model
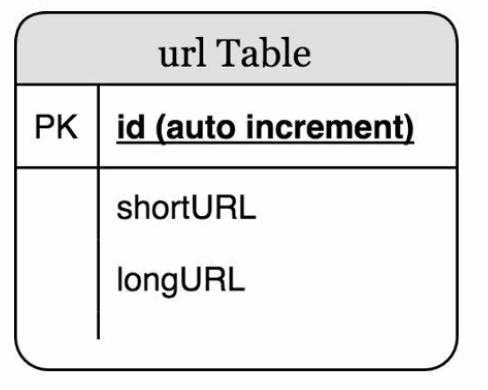
Store <shortURL, longURL> mappings in a relational database to optimize memory usage. The table schema includes:
id (primary key),
shortURL,
longURL.
Redrawn · diagram-design
Hash Function
1. Base 62 Conversion:
Encodes numbers using characters [0-9, a-z, A-Z], providing 62 possible characters.
Base conversion is another approach commonly used for URL shorteners.
A unique id can be assigned to the short url and ID can be base 62 converted to get the short URL.
A 7-character hash supports up to 3.5 trillion unique URLs, enough for 365 billion URLs.
Example: Convert ID 2009215674938 to Base 62:
2009215674938 → zn9edcu.
2. Hash + Collision Resolution:
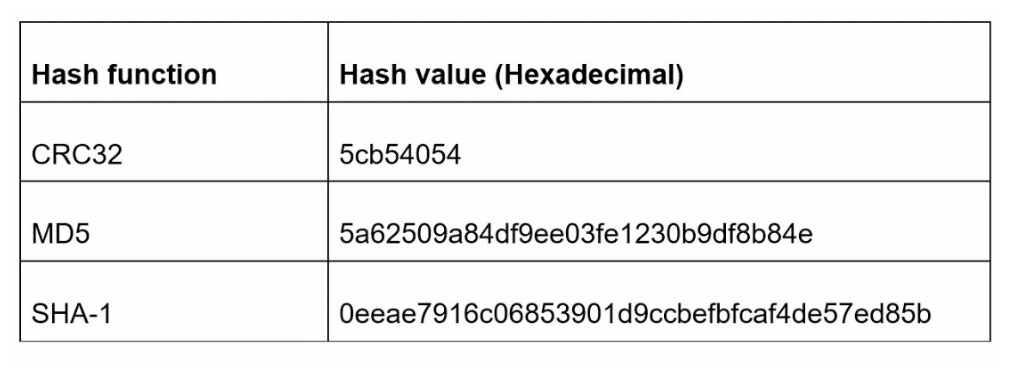
Use hash functions like CRC32, MD5, or SHA-1.
Redrawn · diagram-design
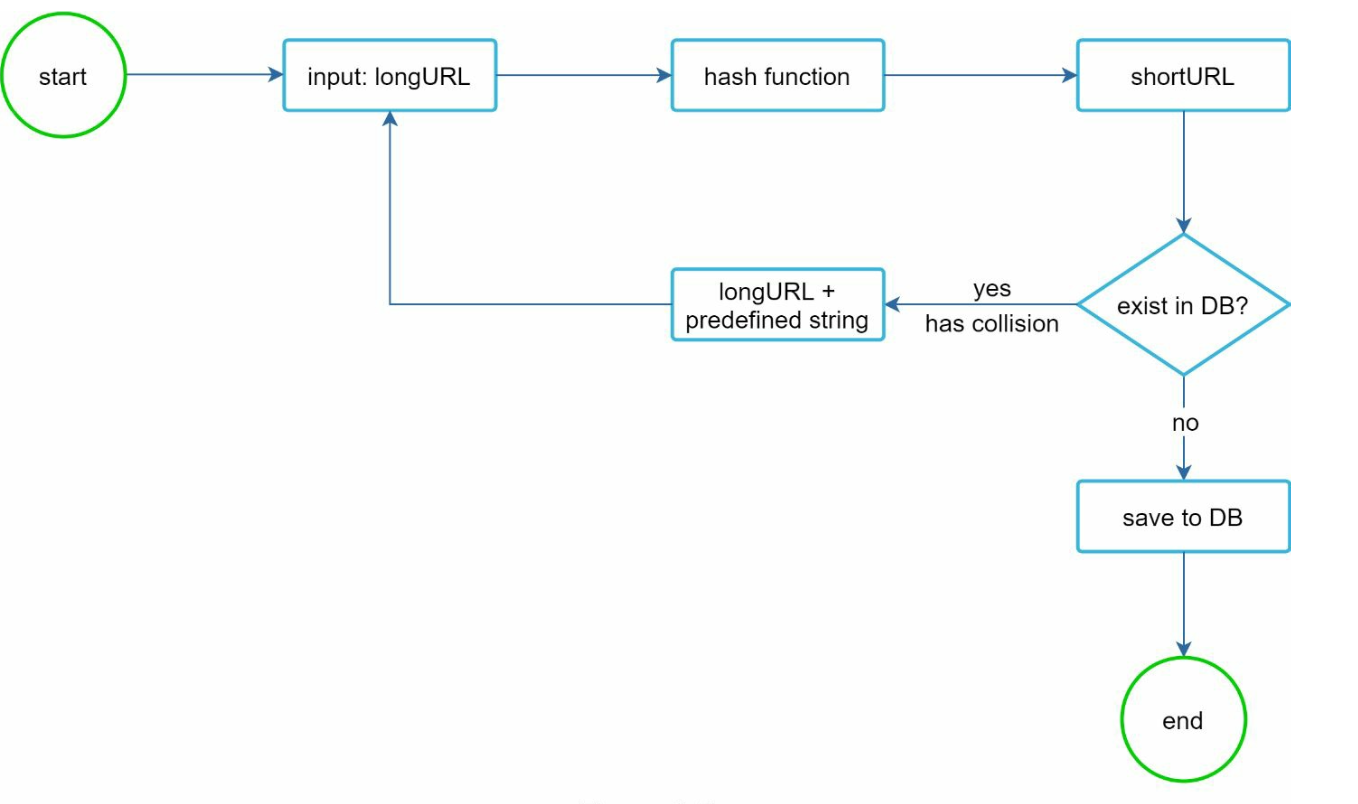
One approach is to collect the first 7 characters of a hash value; however, this method can lead to hash collisions.
To resolve collisions,recursively append a new predefined string until no more collision but this can be expensive.
Resolve collisions with Bloom Filters for efficient lookup.
Redrawn · diagram-design
Comparison
Hash + Collision Resolution:
Fixed short URL length
Does not need a unique ID generator
Collision is possbile and needs resolution
Not possible to find the next available short URL because it does not depend on ID
Base 62 Conversion
The length is not fixed and goes up with ID
It needs a unique ID generator
Collision is not possbile
Easy to find the next short URL if ID increments by 1 (Can be a security concern)
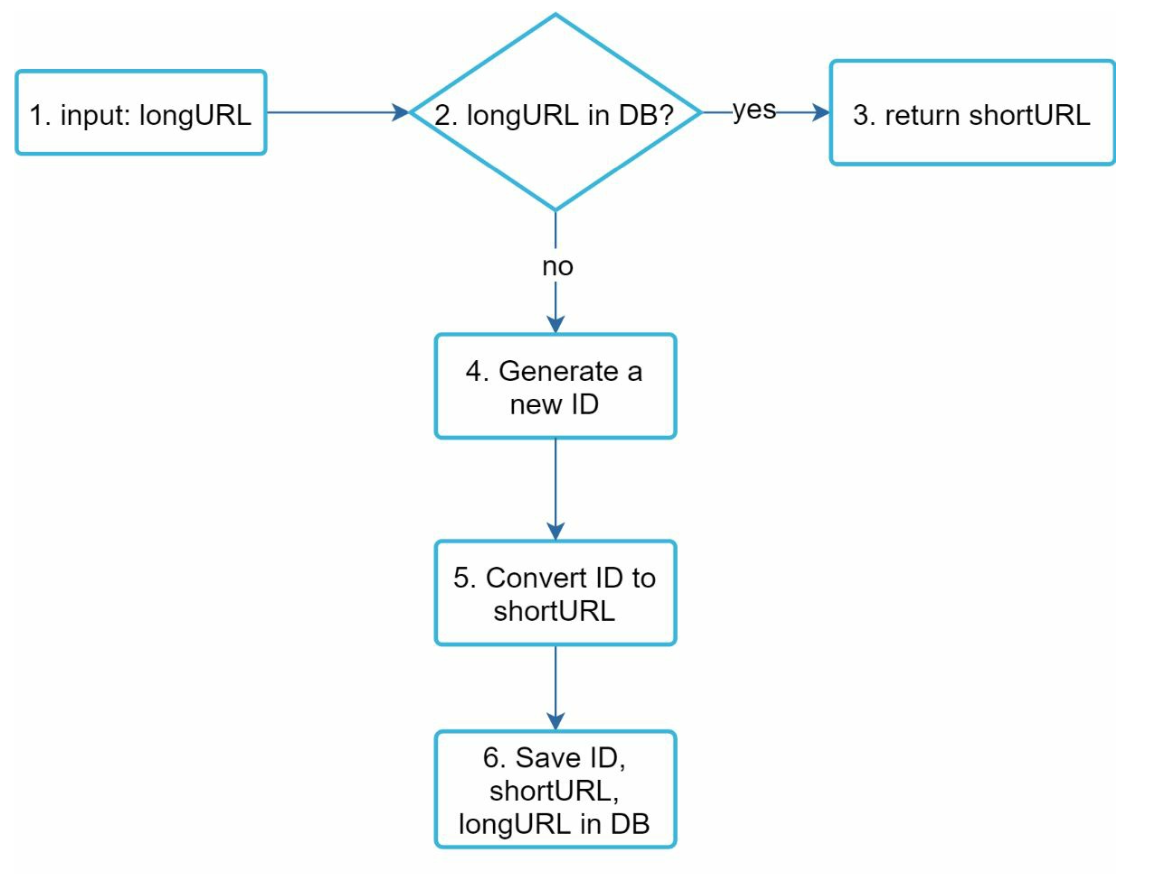
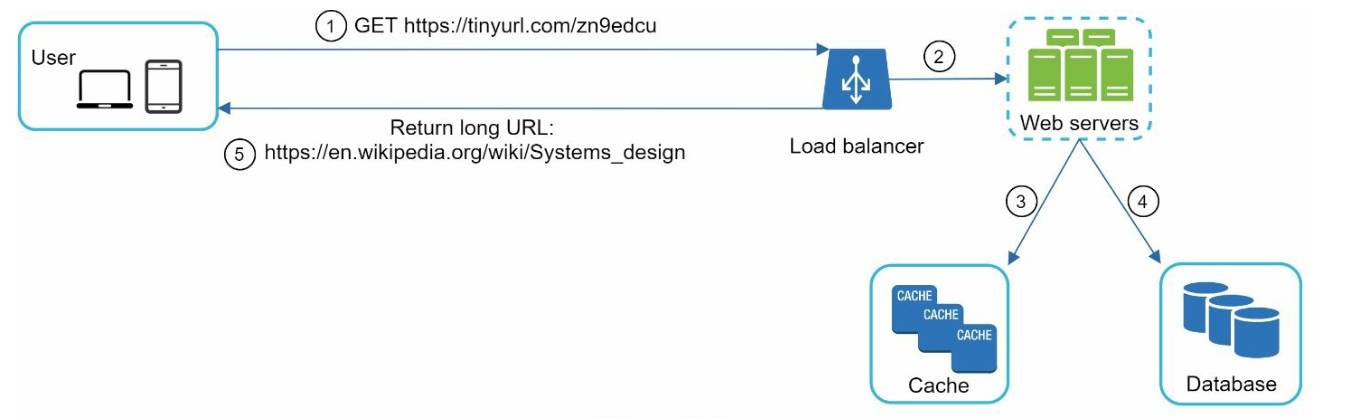
URL Shortening Flow
Redrawn · diagram-design
Check if longURL exists in the database.
If found, return the existing shortURL.
Otherwise:
Generate a unique ID using a distributed ID generator.
Convert the ID to shortURL using Base 62.
Store the <id, shortURL, longURL> mapping in the database.
URL Redirecting Flow
Redrawn · diagram-design
User clicks a shortURL.
Query <shortURL, longURL> mapping:
Check the cache first for faster access.
If not in the cache, query the database.
Redirect the user to longURL.
Additional Considerations
Rate Limiter
Prevent abuse by setting limits on requests per IP.
Scalability
Web Tier: Stateless, scalable by adding/removing web servers.
Database Tier: Use replication and sharding.
Analytics
Collect data like click rates, source, and timestamps for business insights.
High Availability and Reliability
Ensure consistent and reliable services using database replication and fault-tolerant design.
Chapter 9: Design a Web Crawler
Introduction
A web crawler, also known as a spider or robot, is used to discover and collect web content, such as web pages, images, and videos. This chapter focuses on designing a scalable web crawler for search engine indexing.
Applications of Web Crawlers
Search Engine Indexing: Collect web pages to create searchable indexes (e.g., Googlebot).
Web Archiving: Preserve web data for future use (e.g., US Library of Congress).
Web Mining: Extract knowledge from web data (e.g., financial analysis of shareholder reports).
Web Monitoring: Detect copyright or trademark infringements.
Design Challenges
A good web crawler must address:
Scalability: Handle billions of pages using parallelization.
Robustness: Manage bad HTML, crashes, and malicious links.
Politeness: Avoid overwhelming servers with too many requests.
Extensibility: Support new content types with minimal changes.
Step 1: Understanding the Problem
Requirements
Crawl 1 billion web pages per month (400 pages/second, peak 800 QPS).
Collect HTML-only content.
Track new and updated pages.
Ignore duplicate content.
Store crawled data for 5 years, requiring ~30 PB of storage.
Step 2: High-Level Design
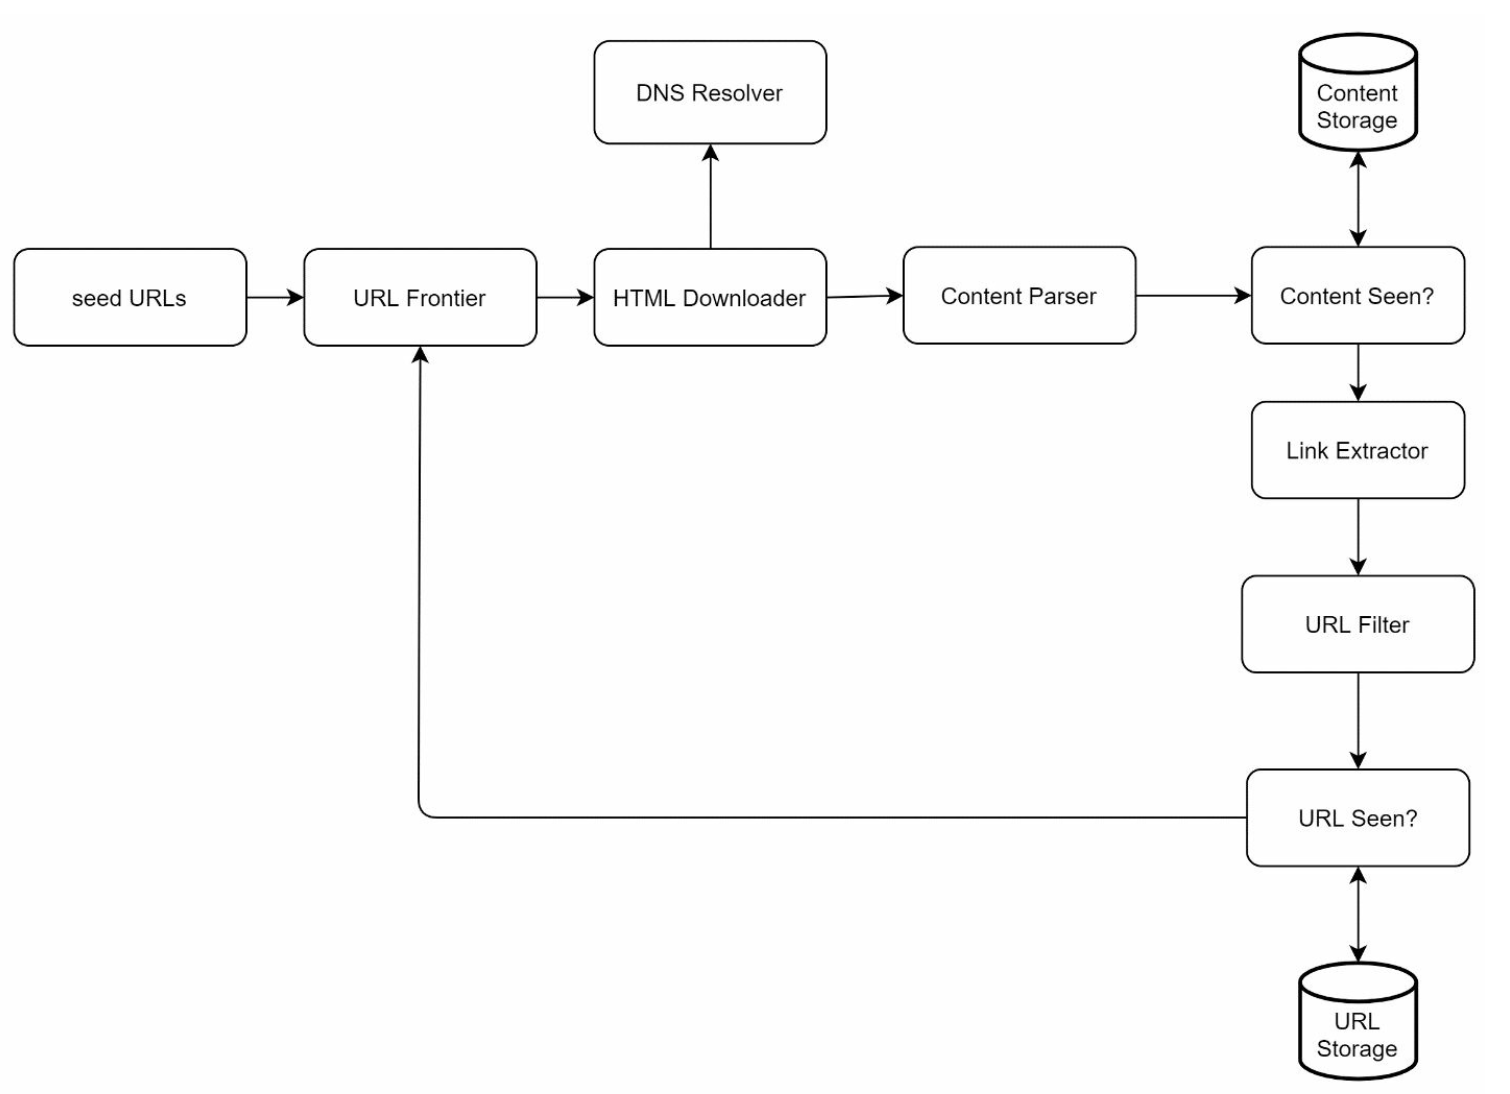
Components
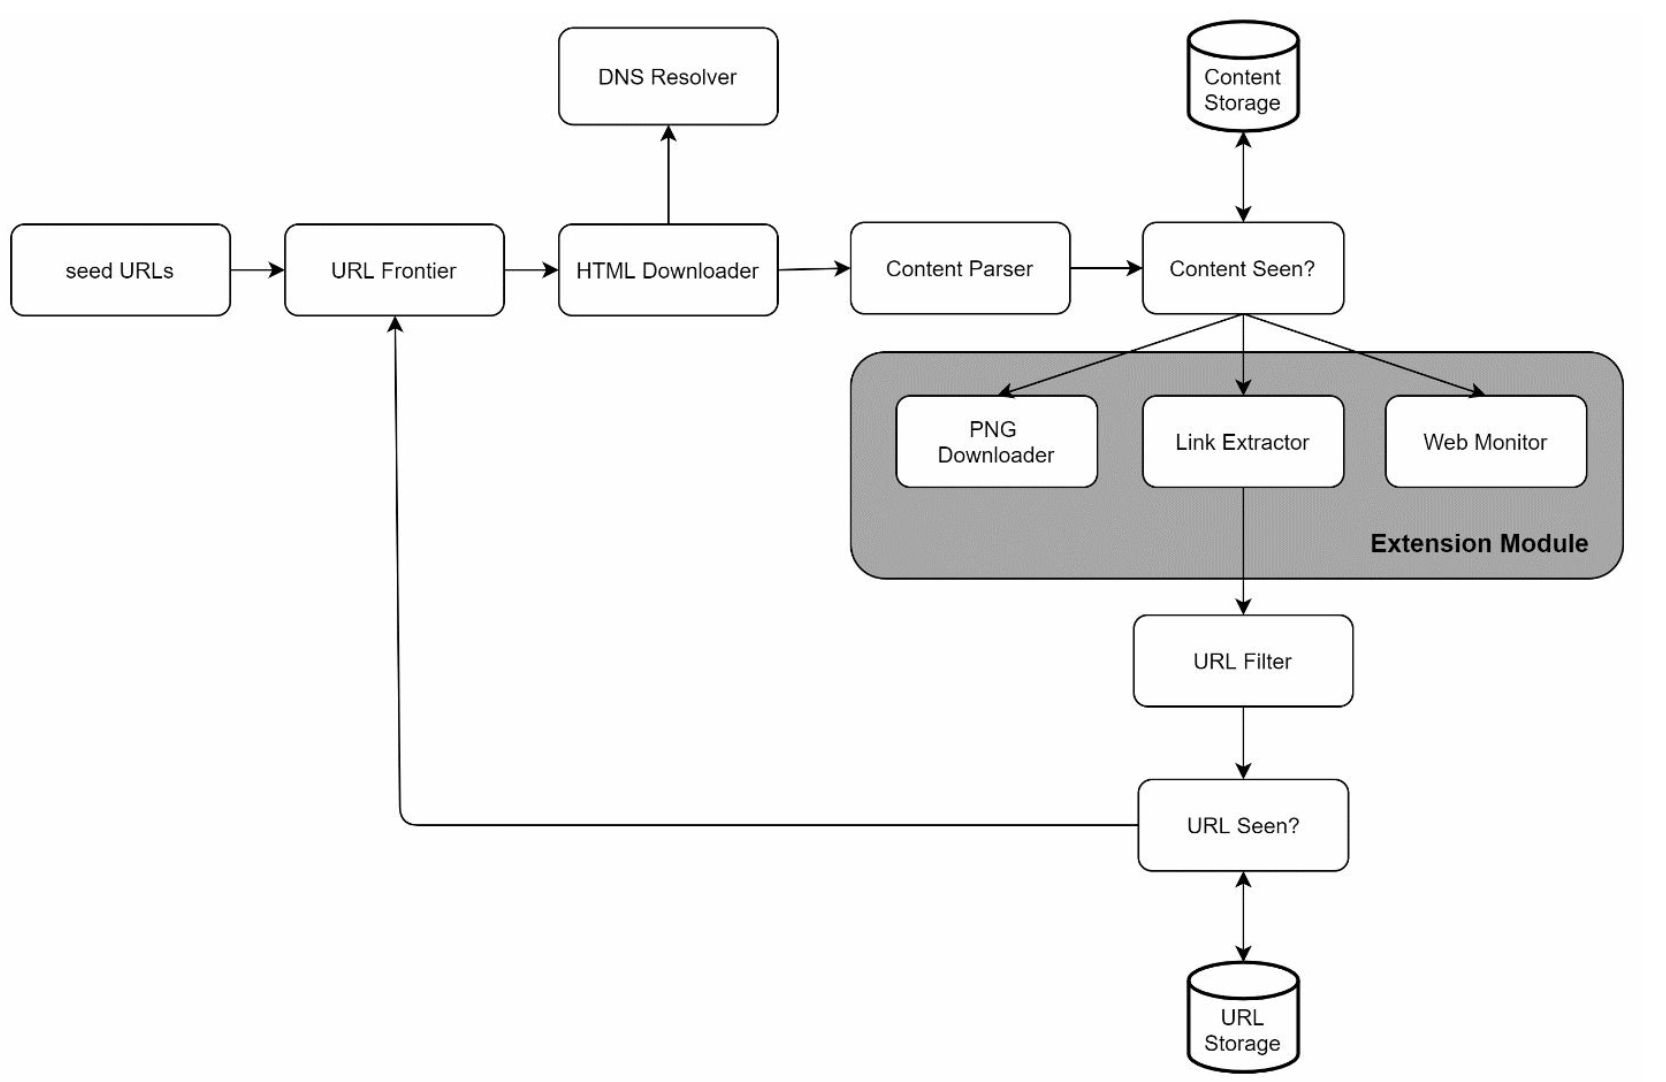
Redrawn · diagram-design
Seed URLs: Starting points for the crawler.
Need to selective as a good starting point that a crawler can utilize to traverse as many links as possible.
Can be based on locality based on different popular website or based on topics.
Strategies: Categorize by locality or topic (e.g., sports, healthcare).
URL Frontier: Stores URLs to be downloaded.
Implemented as a FIFO queue.
HTML Downloader: Downloads web pages from URLs provided by the URL Frontier.
DNS Resolver: Converts URLs to IP addresses.
Content Parser: Validates and parses web pages.
Discards malformed pages.
Content Seen?: Checks for duplicate content using hash comparisons (compare the hash values of the two web pages).
Content Storage: Stores HTML pages on disk (popular content in memory to reduce latency).
URL Extractor: Extracts new links from parsed pages.
URL Filter: Excludes blacklisted or erroneous URLs.
URL Seen? Tracks visited URLs to avoid duplication.
URL Storage: Stores already visited URLs.
Workflow
Add Seed URLs to the URL Frontier.
HTML Downloader fetches URLs and resolves their IPs via the DNS Resolver.
Content Parser validates and passes content to the "Content Seen?" component.
If the content is new, extract links via the URL Extractor.
Filter and add unique links to the URL Frontier.
Step 3: Deep Dive into Key Components
DFS/BFS
The web can be though of as a directed graph where web pages are nodes and hyperlinks (URLs) as edges.
BFS is usually used for graph traversal as the depth can be be very deep thus DFS is not ideal.
Standard BFS does not take the priority of a URL into consideration, not every page has the same level of quality and importance.
URL Frontier
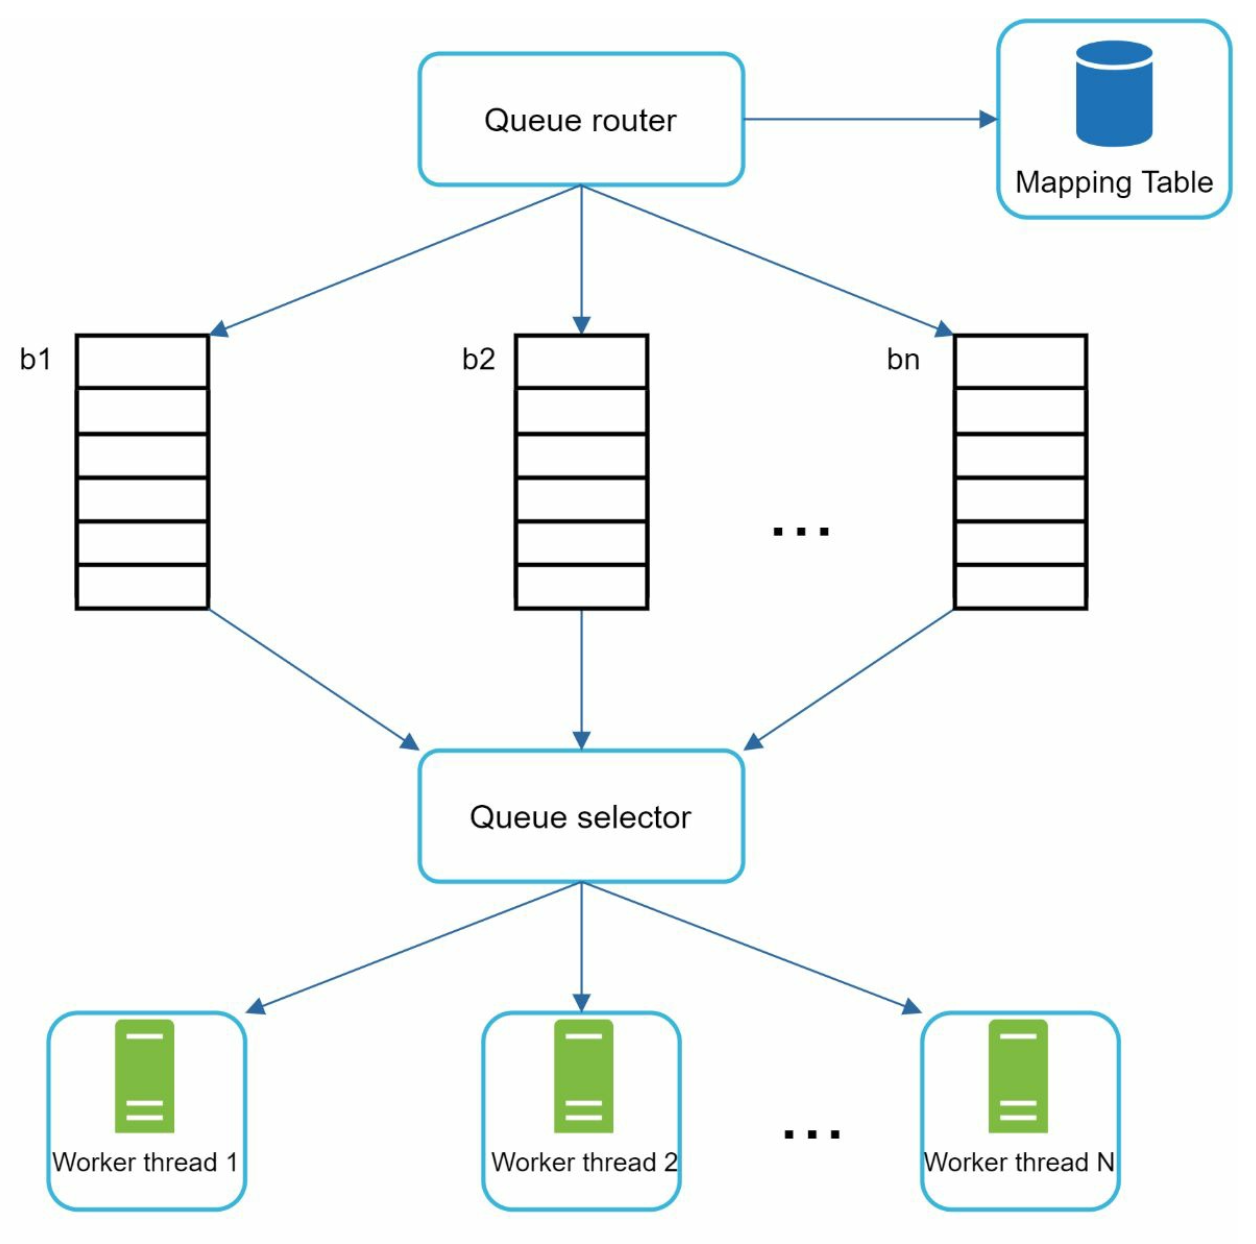
Politeness:
Ensure only one request per host at a time. Add a dealy b/w two download tasks.
Use a mapping from hostnames to queues and worker (download) threads.
Each downloader thread has a separate FIFO queue and only downloads URLs from that queue.
Redrawn · diagram-design
Queue router: Ensures that each queue (b1, b2, … bn) only contains URLs from the same host.
Mapping table: It maps each host to a queue.
Queue selector: Each worker thread is mapped to a FIFO queue, and it only downloads URLs from that queue. The queue selection logic is done by the Queue selector.
Worker thread 1 to N. A worker thread downloads web pages sequentially from the same host. A delay can be added between two download tasks.
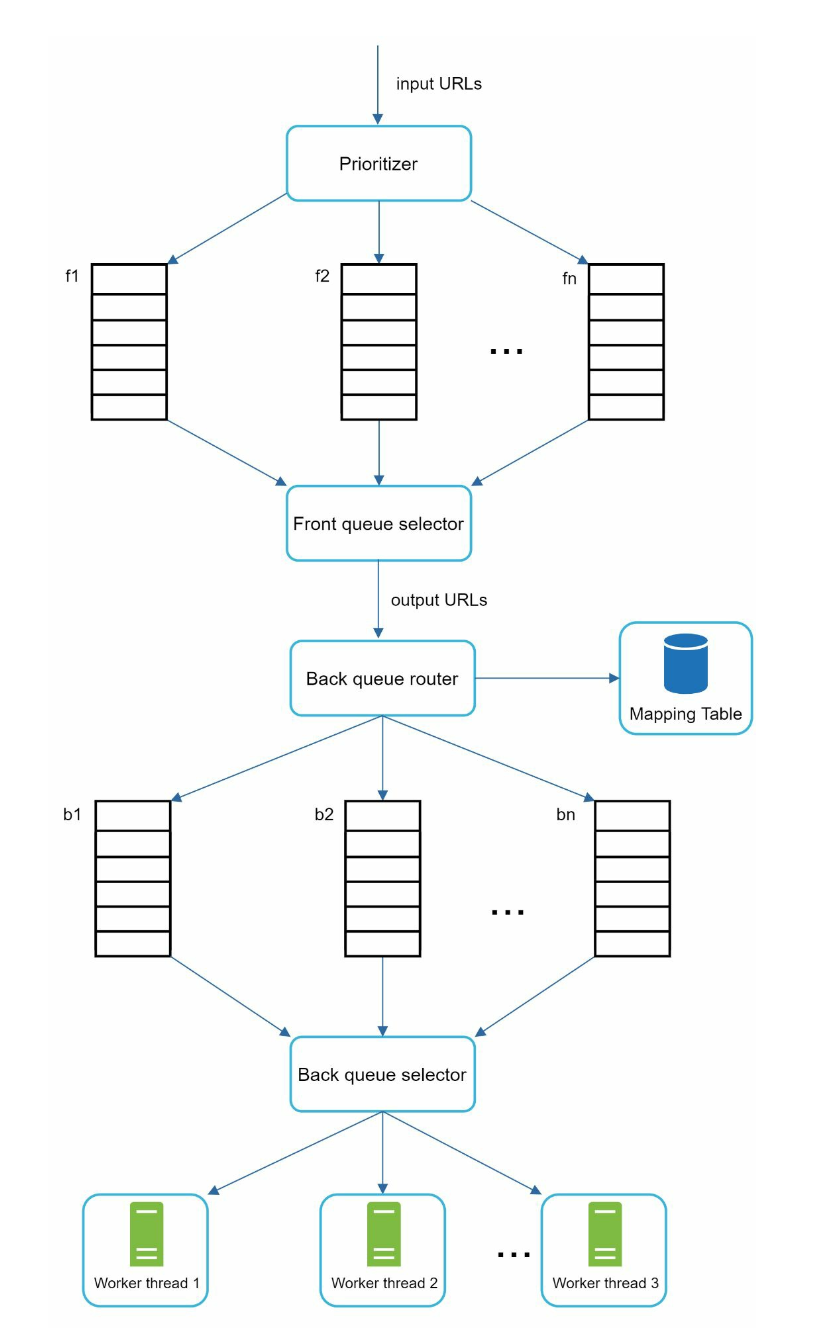
Priority:
Assign higher priority to important pages (e.g., by PageRank or update frequency).
Redrawn · diagram-design
Prioritizer: It takes URLs as input and computes the priorities.
Queue f1 to fn: Each queue has an assigned priority. Queues with high priority are selected with higher probability.
Queue selector: Randomly choose a queue with a bias towards queues with higher priority.
Front queues: manage prioritization
Back queues: manage politeness
Freshness: Recrawl based on update history or importance.
HTML Downloader
Robots.txt Compliance: Respect rules in robots.txt files.
Performance Optimizations:
Distributed crawling using multiple servers.
Use a DNS cache to avoid repeated lookups.
Geographically distribute crawl servers for faster downloads.
Use a short timeout to avoid slow or unresponsive servers.
Robustness
Consistent Hashing: Distribute load among servers effectively.
Error Handling: Prevent system crashes from exceptions.
Data Validation: Ensure content integrity.
Extensibility
Add modules for new content types (e.g., PNG downloader, web monitor).
Example: Plug in a module to monitor web content for copyright violations.
Redrawn · diagram-design
Avoiding Problematic Content
Duplicate Content: Detect using hash comparisons.
Spider Traps: Avoid infinite loops with techniques like URL length limits.
Data Noise: Filter irrelevant content like ads or spam.
Step 4: Wrap Up
Key Takeaways
Web crawlers must balance scalability, robustness, politeness, and extensibility.
Politeness prevents overloading servers, while priority ensures important pages are crawled first.
Efficient storage and error handling are crucial for handling large-scale crawling.
Additional Considerations
Server-Side Rendering: Handle dynamic content generated by JavaScript or AJAX.
Anti-Spam Measures: Exclude low-quality or irrelevant pages.
Database Sharding: Scale the data layer using replication and sharding.
Horizontal Scaling: Use stateless servers to scale crawl jobs efficiently.
Analytics: Collect and analyze data for insights.
Chapter 10: Design a Notification System
Introduction
A notification system is essential for modern applications, providing timely updates like product notifications, events, offers, and alerts. Notifications can be sent through:
Push notifications (mobile or desktop),
SMS messages, and
Emails.
The chapter focuses on designing a scalable system capable of sending millions of notifications daily.
Step 1: Understanding the Problem
Requirements
Notification Types: Push notifications, SMS, and Emails.
Delivery: Soft real-time system with minimal delays.
Platforms: iOS, Android, and desktop.
Triggers: Notifications can be triggered by client applications or scheduled on servers.
Scale:
Push Notifications: 10 million/day,
SMS: 1 million/day,
Emails: 5 million/day.
Opt-out Support: Users can disable specific notification types.
Step 2: High-Level Design
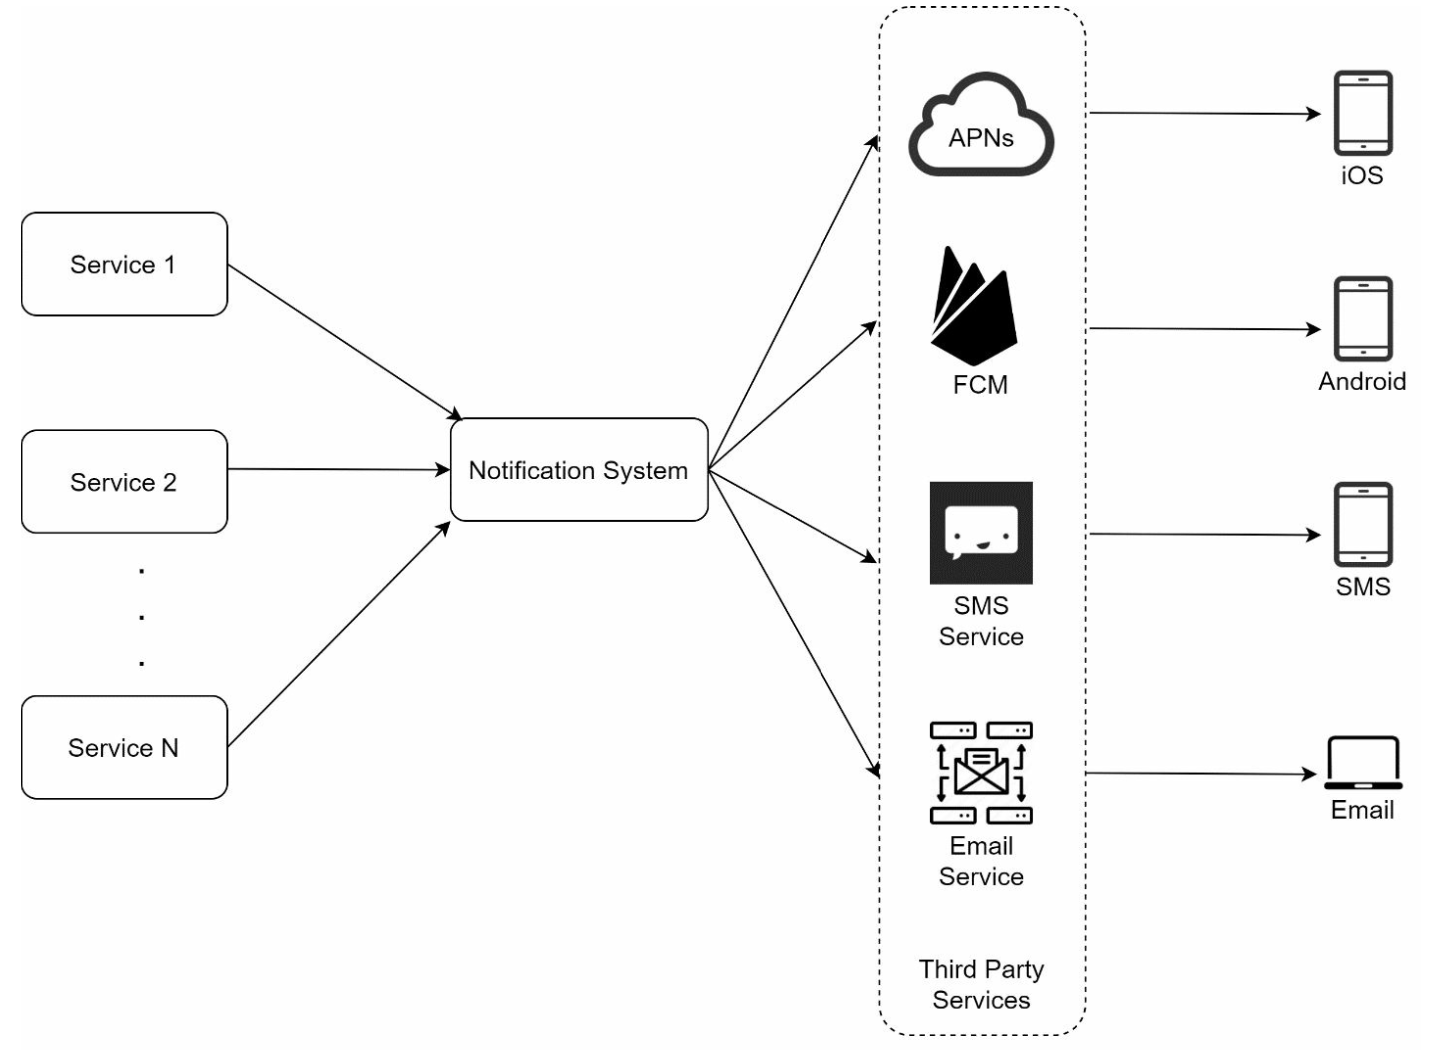
Components
Notification Types:
iOS Push Notifications: Use Apple Push Notification Service (APNS).
Android Push Notifications: Use Firebase Cloud Messaging (FCM).
SMS Messages: Third-party services like Twilio or Nexmo.
Emails: Commercial email services like SendGrid or Mailchimp.
Contact Info Gathering:
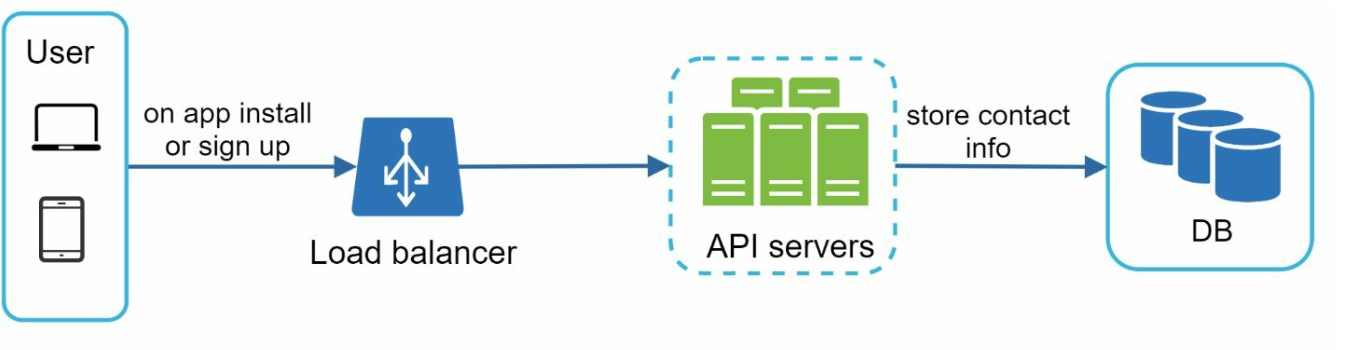
Redrawn · diagram-design
Collect device tokens, phone numbers, or email addresses during app installation or signup.
Store contact info in the database:
Device Tokens Table: For push notifications.
User Table: For emails and phone numbers.
Notification Sending Flow:
Redrawn · diagram-design
Trigger Services:
Generate events to initiate notifications (e.g., billing reminders, shipping updates).
A service can be a micro-service, a cron job, or a distributed system that triggers notification sending events.
Notification Server:
Provide APIs for services to send notifications.
Carry out basic validations to verify emails, phone numbers.
Query the database or cache to fetch data needed to render a notification.
Third-Party Services: Deliver notifications to users.
Challenges in Initial Design
Single Point of Failure (SPOF): One notification server can crash the entire system.
Scalability Issues: Hard to scale databases, caches, and processing components independently.
Performance Bottlenecks: High resource demands for sending notifications.
Improved Design
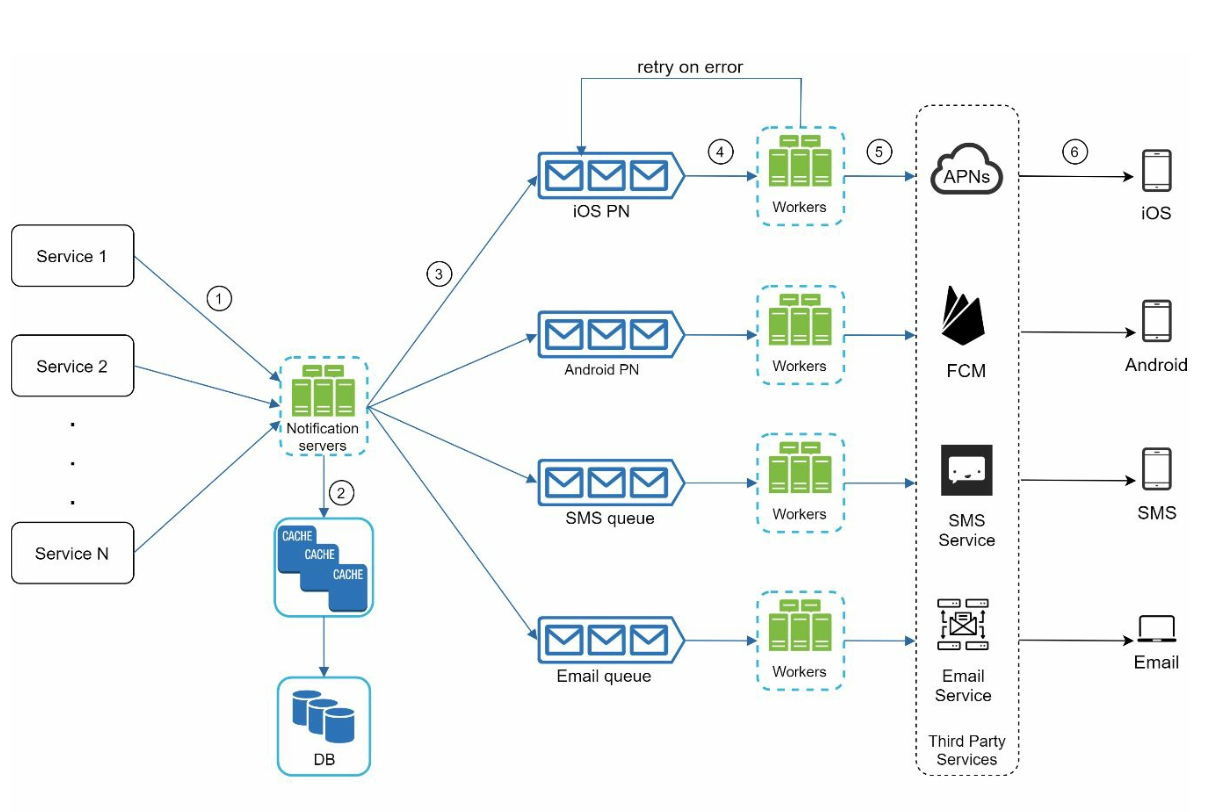
Redrawn · diagram-design
Move databases and caches out of the notification server.
Introduce horizontal scaling with multiple notification servers.
Use message queues to decouple system components.
Message queues serve as buffers when high volumes of notifications are to be sent out.
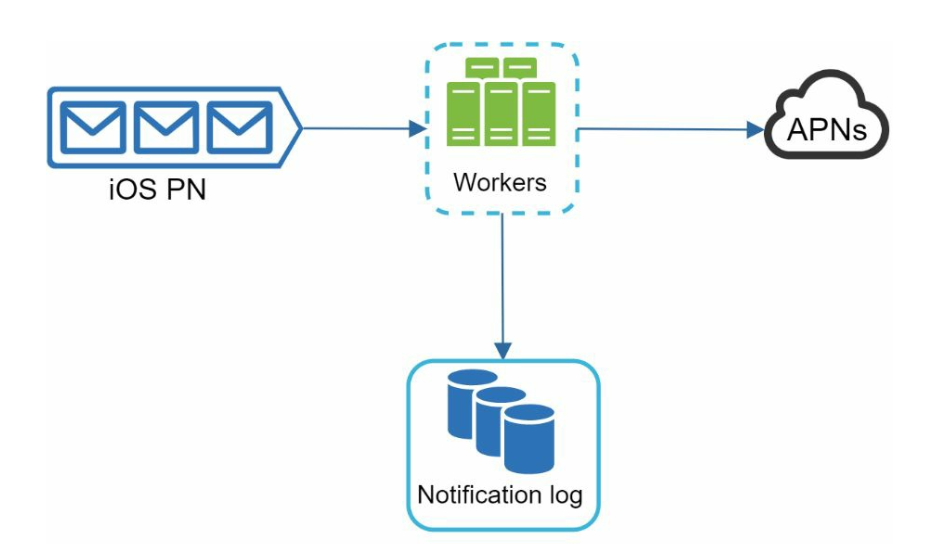
Add workers that pull notification events from message queues and send them to corresponding third party services.
Step 3: Design Deep Dive
Reliability
Prevent Data Loss:
Redrawn · diagram-design
Persist notification data in a database and implement a retry mechanism.
The Notification log database is included for data persistence.
Deduplication:
Check event IDs to avoid sending duplicate notifications.
When a notification event first arrives, check if it is seen before by checking the event ID.
If seen before discard it, otherwise send out the notification.
Additional Components
Redrawn · diagram-design
Notification Templates: Preformatted templates for consistent and efficient notifications.
Notification Settings:
Users can opt-in or opt-out for specific channels (push, SMS, or email).
Stored in a dedicated notification settings table.
Rate Limiting: Cap the frequency of notifications sent to users.
Retry Mechanism: Retry sending notifications if third-party services fail.
Monitoring Queues: Track queued notifications to scale workers dynamically.
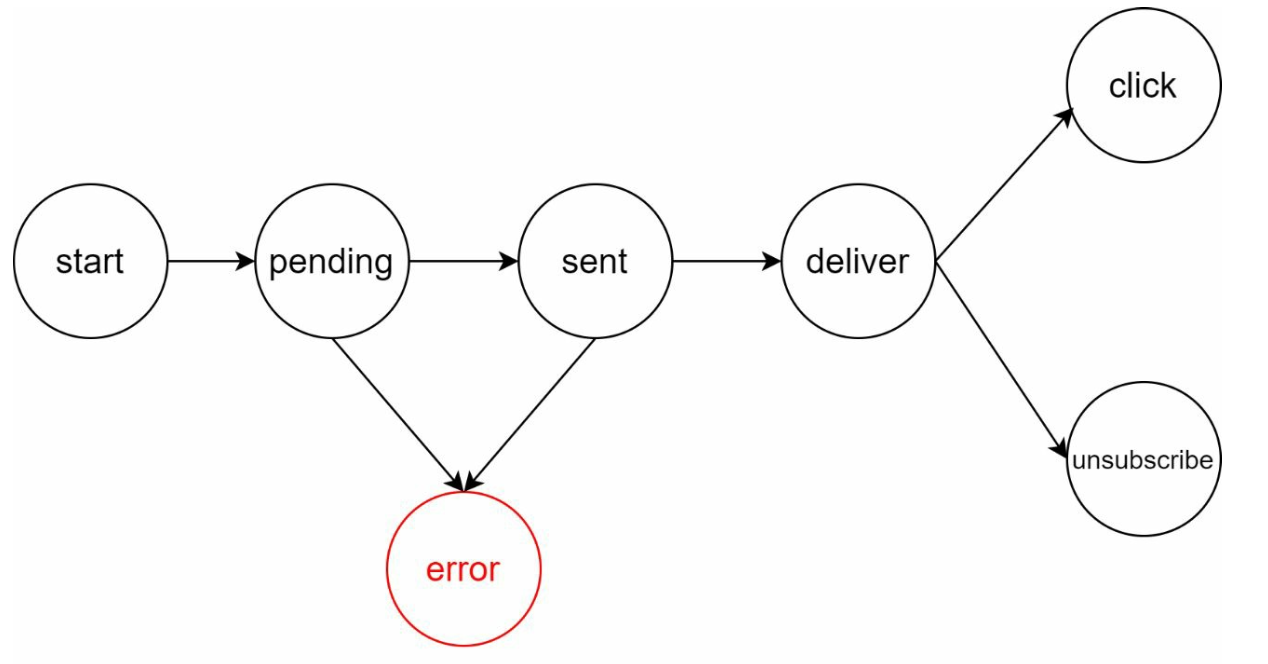
Event Tracking: Collect metrics like open rate, click rate, and engagement.
Security
Use AppKey and AppSecret to authenticate and secure APIs for push notifications.
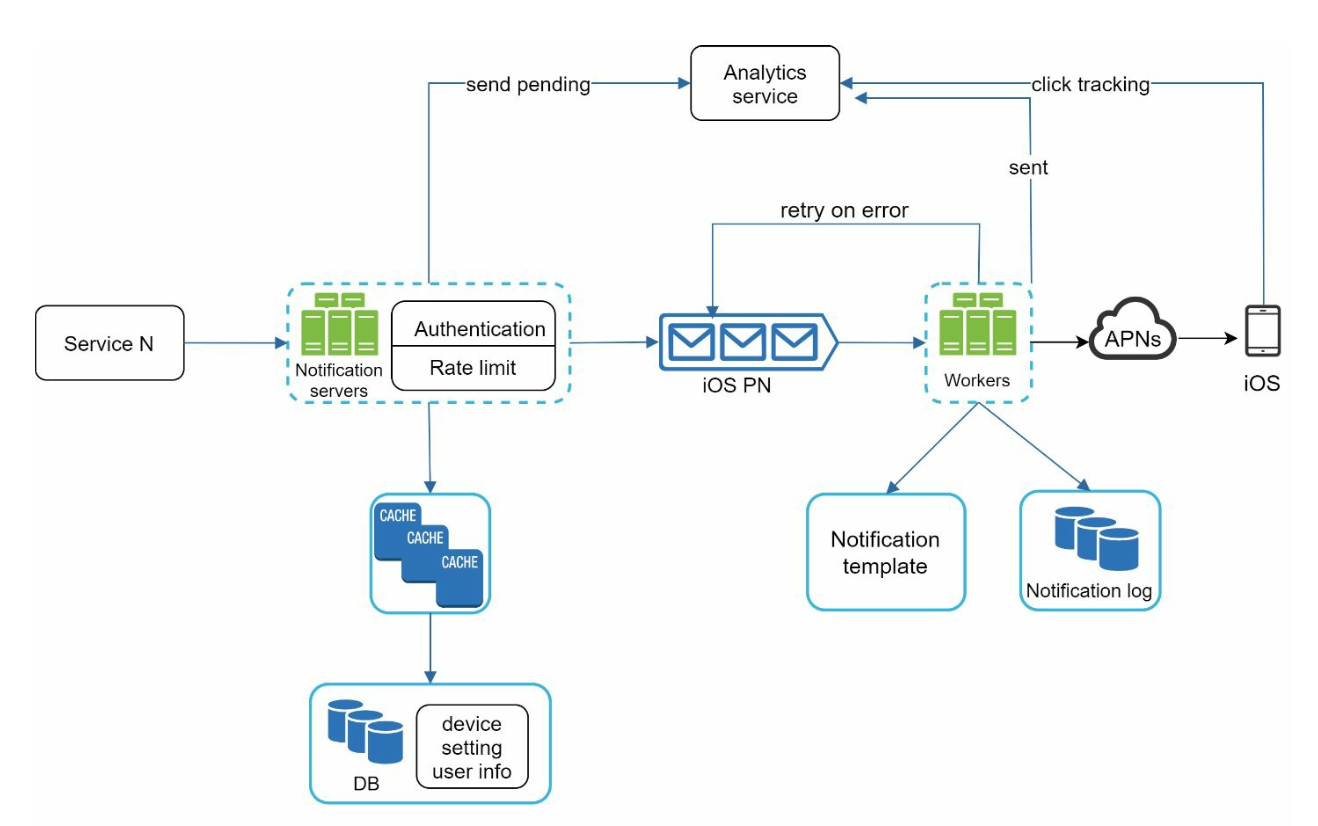
Notification Flow
Redrawn · diagram-design
Trigger services call APIs to send notifications.
Notification servers validate requests and fetch metadata from caches or databases.
Notification events are sent to message queues.
Workers process events and interact with third-party services.
Third-party services deliver notifications to users.
Key Optimizations
Horizontal Scaling: Add more notification servers for load distribution.
Message Queues: Decouple processing to handle high volumes.
Caching: Reduce latency by caching frequently accessed data.
Distributed Crawling: Optimize message delivery geographically for better performance.
Chapter 11: Design a News Feed System
Introduction
A news feed system displays a constantly updating list of posts (status updates, photos, videos, and links) from a user’s connections. Examples include Facebook’s news feed, Instagram’s feed, and Twitter’s timeline. This chapter explores the design of a scalable news feed system.
Step 1: Understanding the Problem
Requirements
Platform: The system supports both web and mobile apps.
Features:
Users can publish posts.
Users can view posts from friends in their news feed.
Sorting: Feeds are sorted in reverse chronological order for simplicity.
Scale:
Users can have up to 5,000 friends.
10 million daily active users (DAU).
Feeds may include text, images, and videos.
Step 2: High-Level Design
Overview
The design includes two main flows:
Feed Publishing: A user publishes a post, which is written to the database and propagated to their friends’ feeds.
News Feed Building: A user retrieves their news feed by aggregating posts from friends in reverse chronological order.
News Feed APIs
Feed Publishing API:
Endpoint:POST /v1/me/feed
Params:content (post text) and auth_token (authentication).
News Feed Retrieval API:
Endpoint:GET /v1/me/feed
Params:auth_token (authentication).
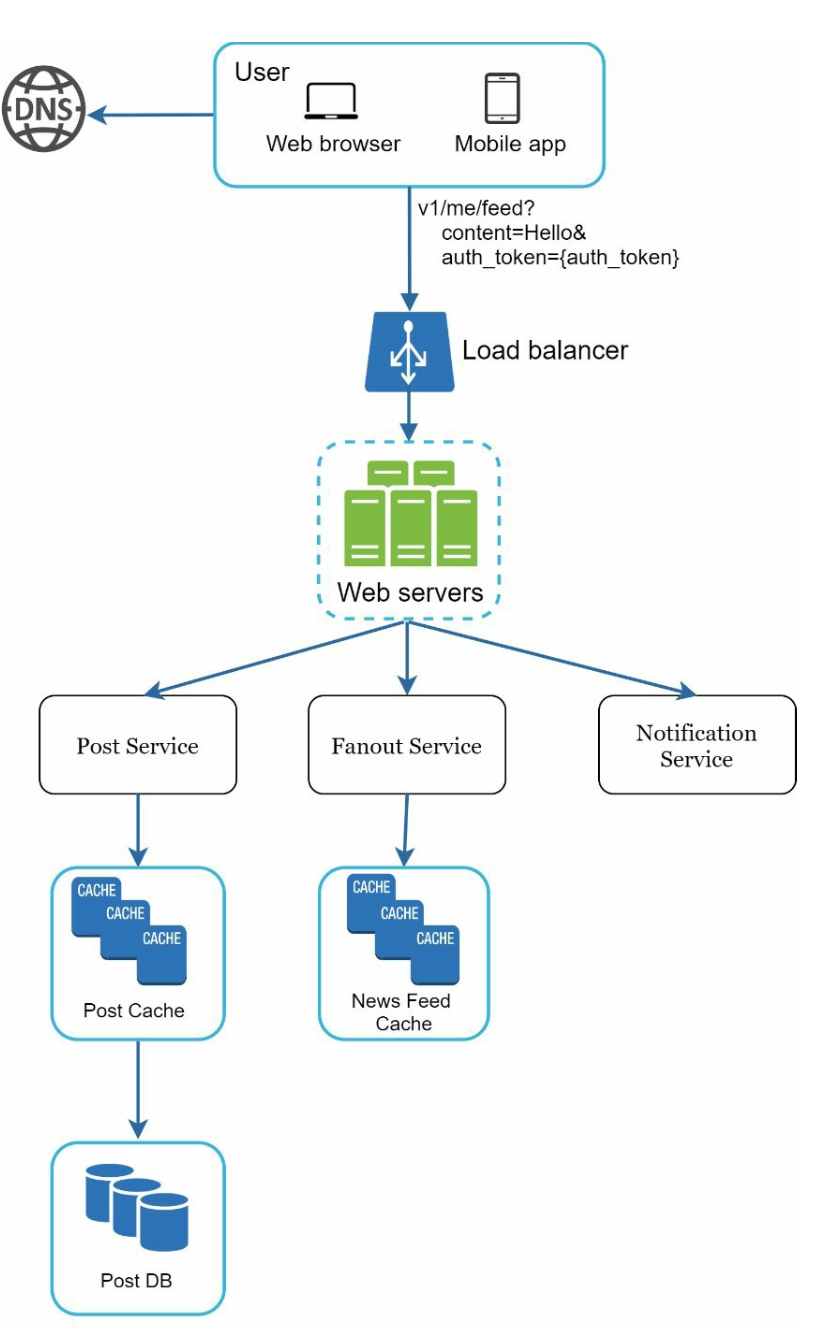
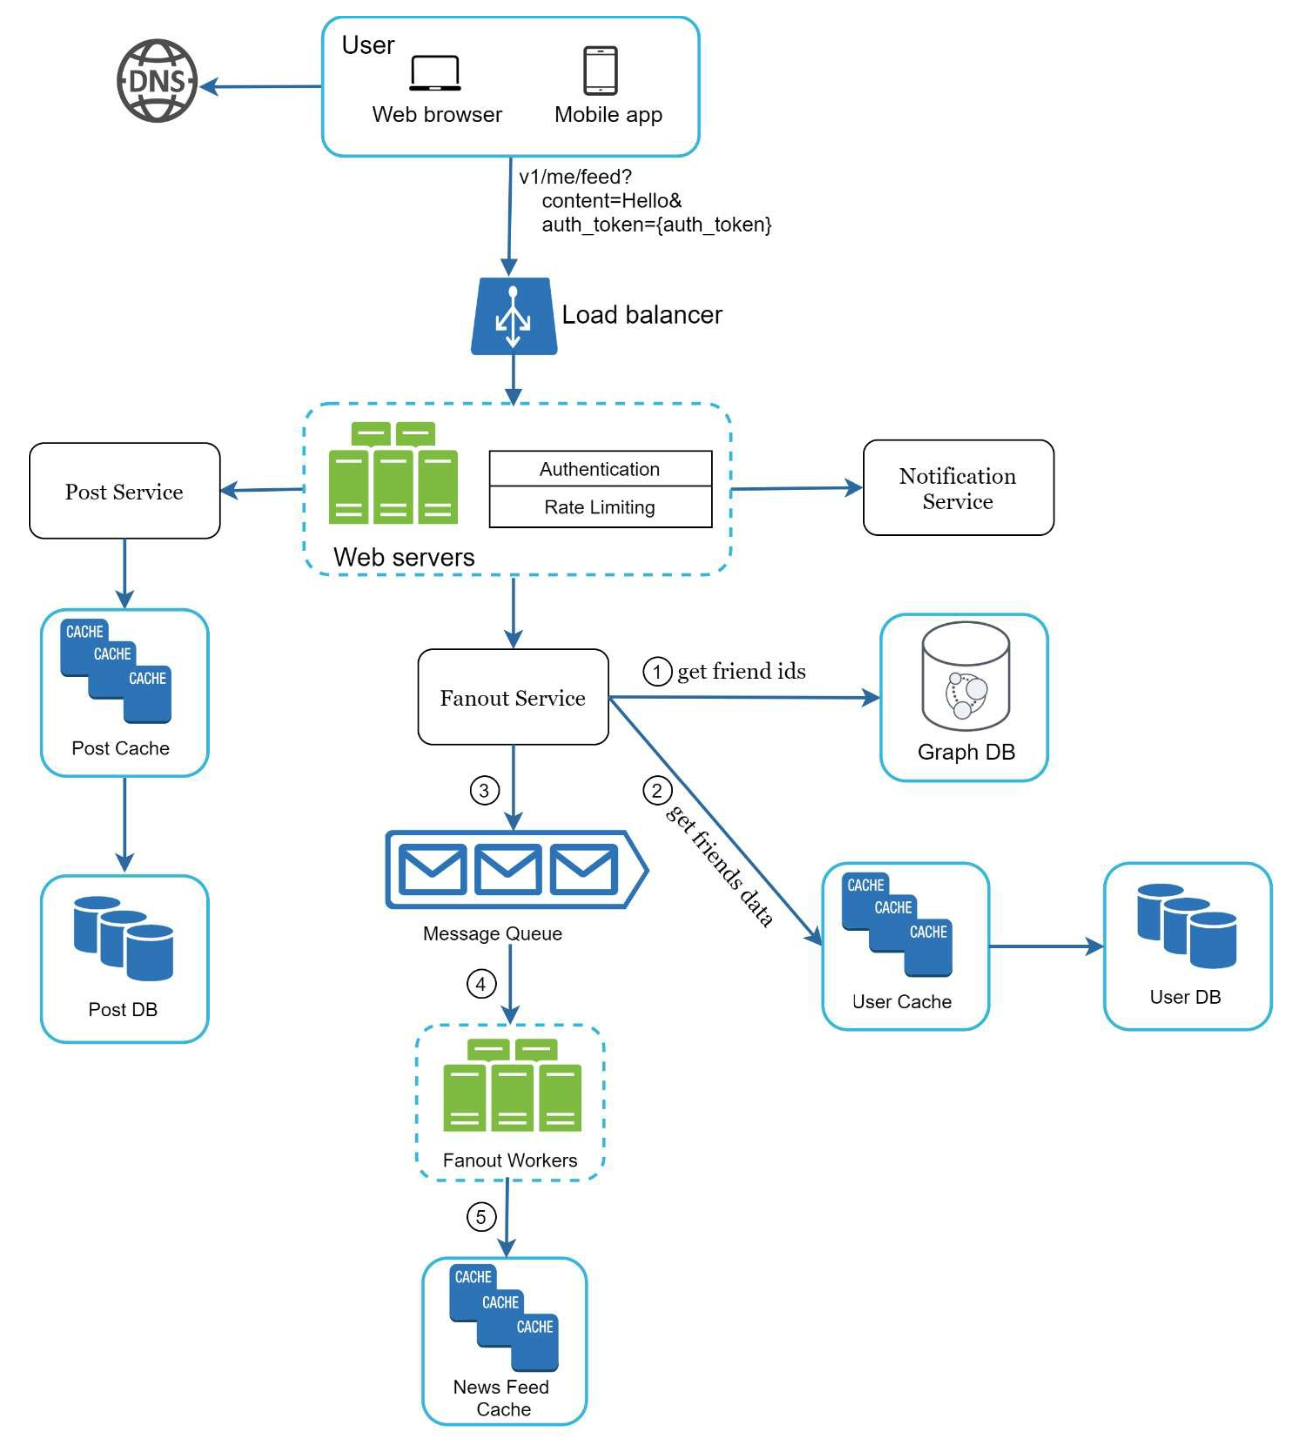
Feed Publishing
Redrawn · diagram-design
User Interaction: The user publishes a post via the feed publishing API.
Load Balancer: Distributes traffic to web servers.
Web Servers: Authenticate requests and redirect to services.
Post Service: Stores the post in the database and cache.
Fanout Service: Propagates the post to friends’ news feeds in the cache.
Notification Service: Sends notifications to friends.
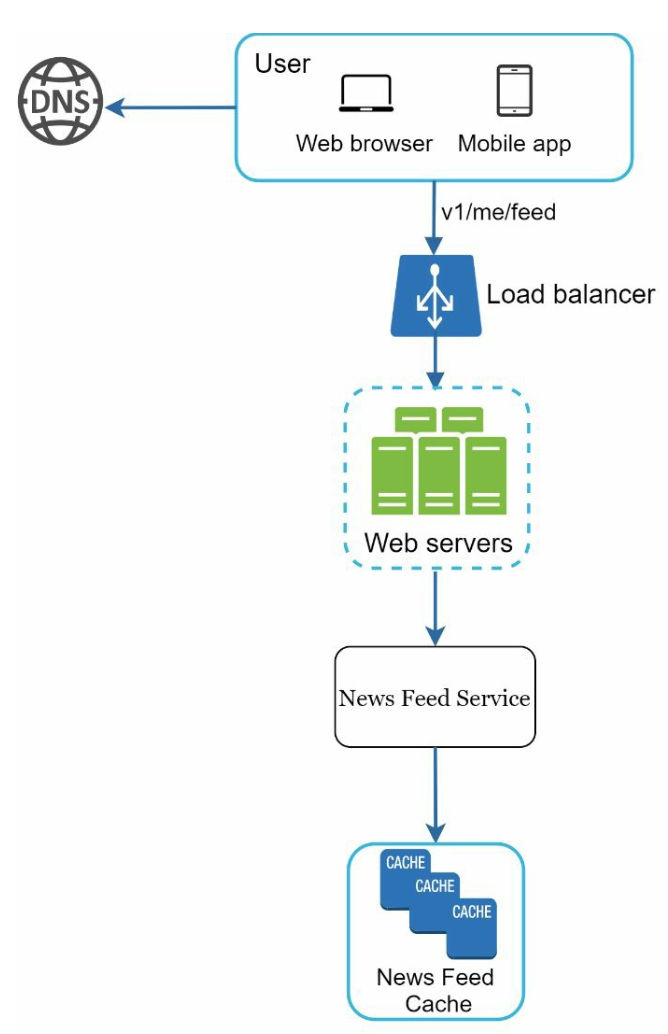
News Feed Building
Redrawn · diagram-design
User Interaction: The user requests their news feed via the retrieval API.
Load Balancer: Distributes traffic to web servers.
Web Servers: Forward requests to the news feed service.
News Feed Service: Fetches post IDs from the news feed cache and retrieves complete post details from the database or cache.
Step 3: Design Deep Dive
Feed Publishing Deep Dive
Web Servers:
Authenticate users using auth_token.
Enforce rate limits to prevent spam.
Fanout Service:
Fanout on Write: Push posts to friends’ feeds at write time.
Pros: Real-time updates, fast feed retrieval.
Cons: Resource-intensive for users with many friends.
Fanout on Read: Pull posts at read time.
Pros: Efficient for inactive users.
Cons: Slower feed retrieval.
Hybrid Approach: Use a push model for most users and a pull model for high-connection users (e.g., celebrities).
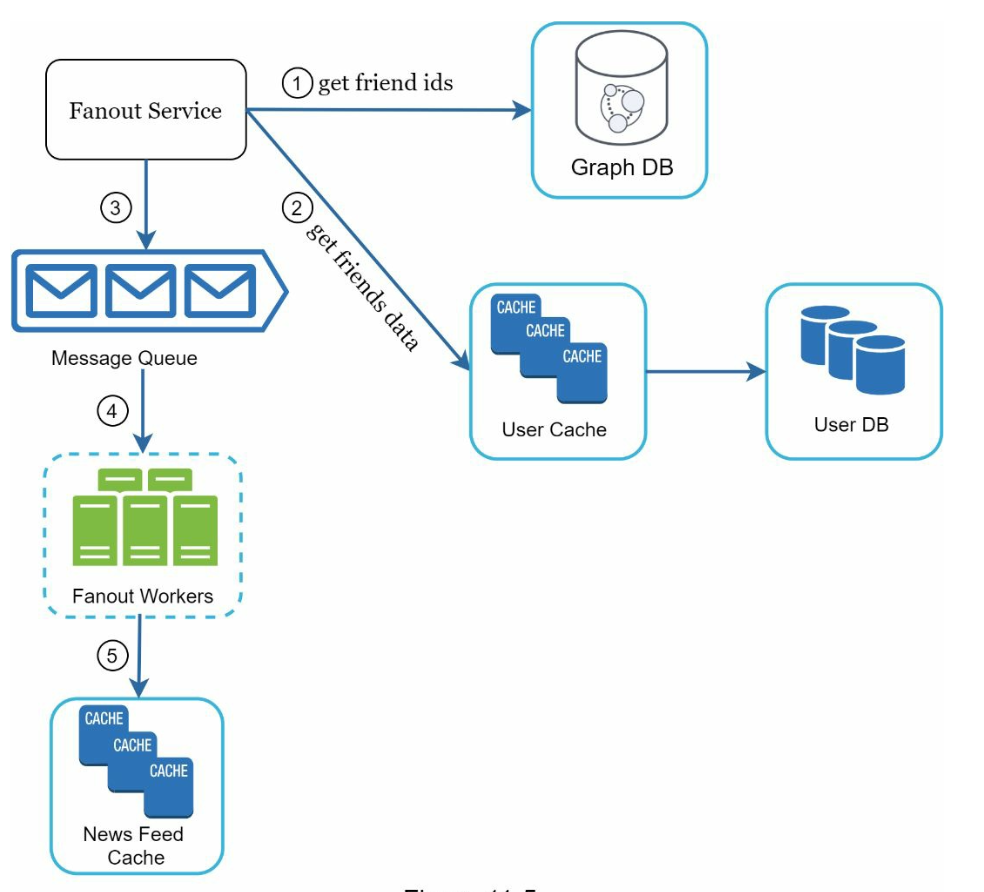
Redrawn · diagram-design
The fanout service works as following:
Fetch Friend IDs: Retrieve the friend list from a graph database.
Filter Friends from Cache: Access user settings in the cache to exclude certain friends (e.g., muted friends or selective sharing preferences).
Send to Message Queue: Send the filtered friend list along with the new post ID to a message queue for processing.
Fanout Workers: Workers retrieve data from the message queue and update the news feed cache. The cache stores <post_id, user_id> mappings instead of full user and post objects to save memory.
Store in News Feed Cache: Append new post IDs to the friends’ news feed cache. A configurable limit ensures that only recent posts are stored, as most users focus on the latest content, keeping cache memory consumption manageable.
Redrawn · diagram-design
News Feed Retrieval Deep Dive
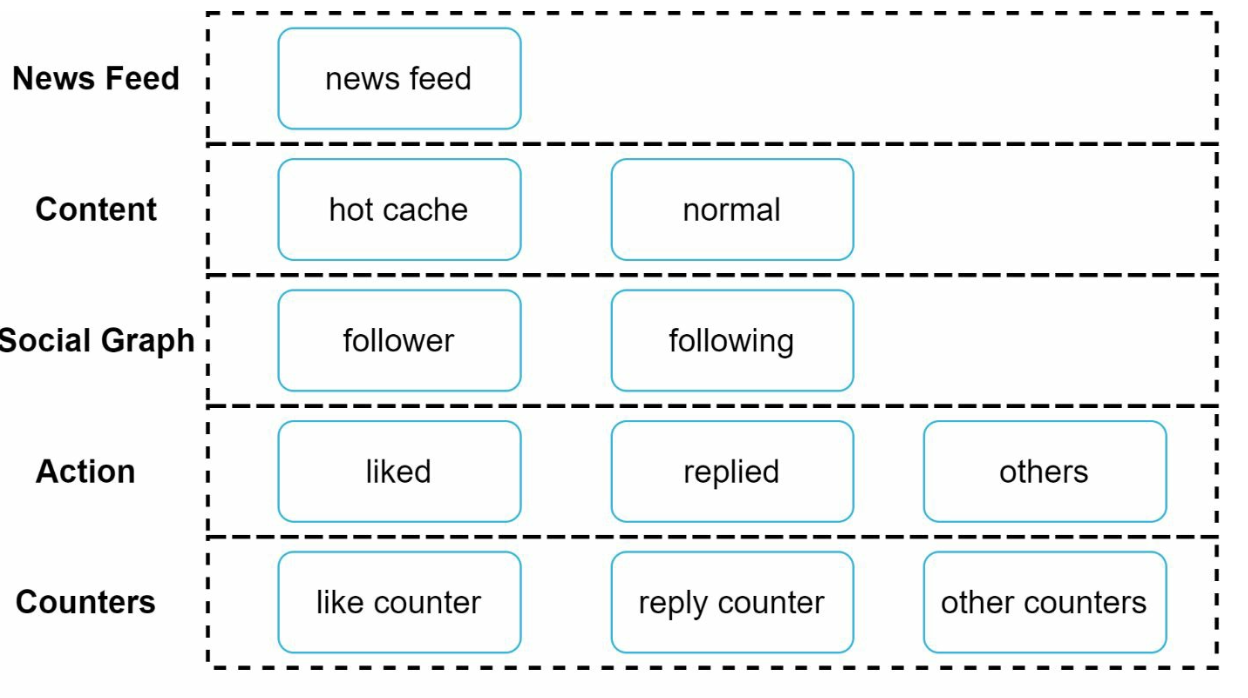
Cache Architecture
The cache is divided into five layers:
News Feed Cache: Stores post IDs for quick retrieval.
Content Cache: Stores post details (popular posts in hot cache).
Social Graph Cache: Stores user relationship data.
Action Cache: Tracks user actions (likes, replies, shares).
Counter Cache: Maintains counts for likes, replies, followers, etc.
Redrawn · diagram-design
Key Optimizations
Scaling
Database Scaling:
Horizontal scaling and sharding.
Use of read replicas for high-traffic queries.
Stateless Web Tier: Keep web servers stateless to enable horizontal scaling.
Caching
Store frequently accessed data in memory.
Use cache layers to reduce latency and database load.
Reliability
Consistent Hashing: Distribute requests evenly across servers.
Message Queues: Decouple system components and buffer traffic.
Monitoring
Track key metrics like QPS (queries per second) and latency.
Monitor cache hit rates and adjust configurations accordingly.
Chapter 12: Design a Chat System
Introduction
A chat system supports real-time messaging between users. This chapter focuses on designing a chat app that includes:
One-on-One Chat
Group Chat (max 100 users)
Online Presence Indicators
Multiple Device Support
Push Notifications
The system targets 50 million daily active users (DAU) and stores chat history permanently.
Step 1: Understanding the Problem
Requirements
Features:
One-on-one and group chat (max 100 members).
Text-based messages (up to 100,000 characters).
Online/offline indicators.
Support for multiple devices.
Push notifications.
Scale: Design for 50 million DAU.
Storage: Permanent chat history.
Step 2: High-Level Design
Communication Protocols
Sender Side: HTTP for sending messages, leveraging persistent connections for efficiency.
Redrawn · diagram-design
Receiver Side:
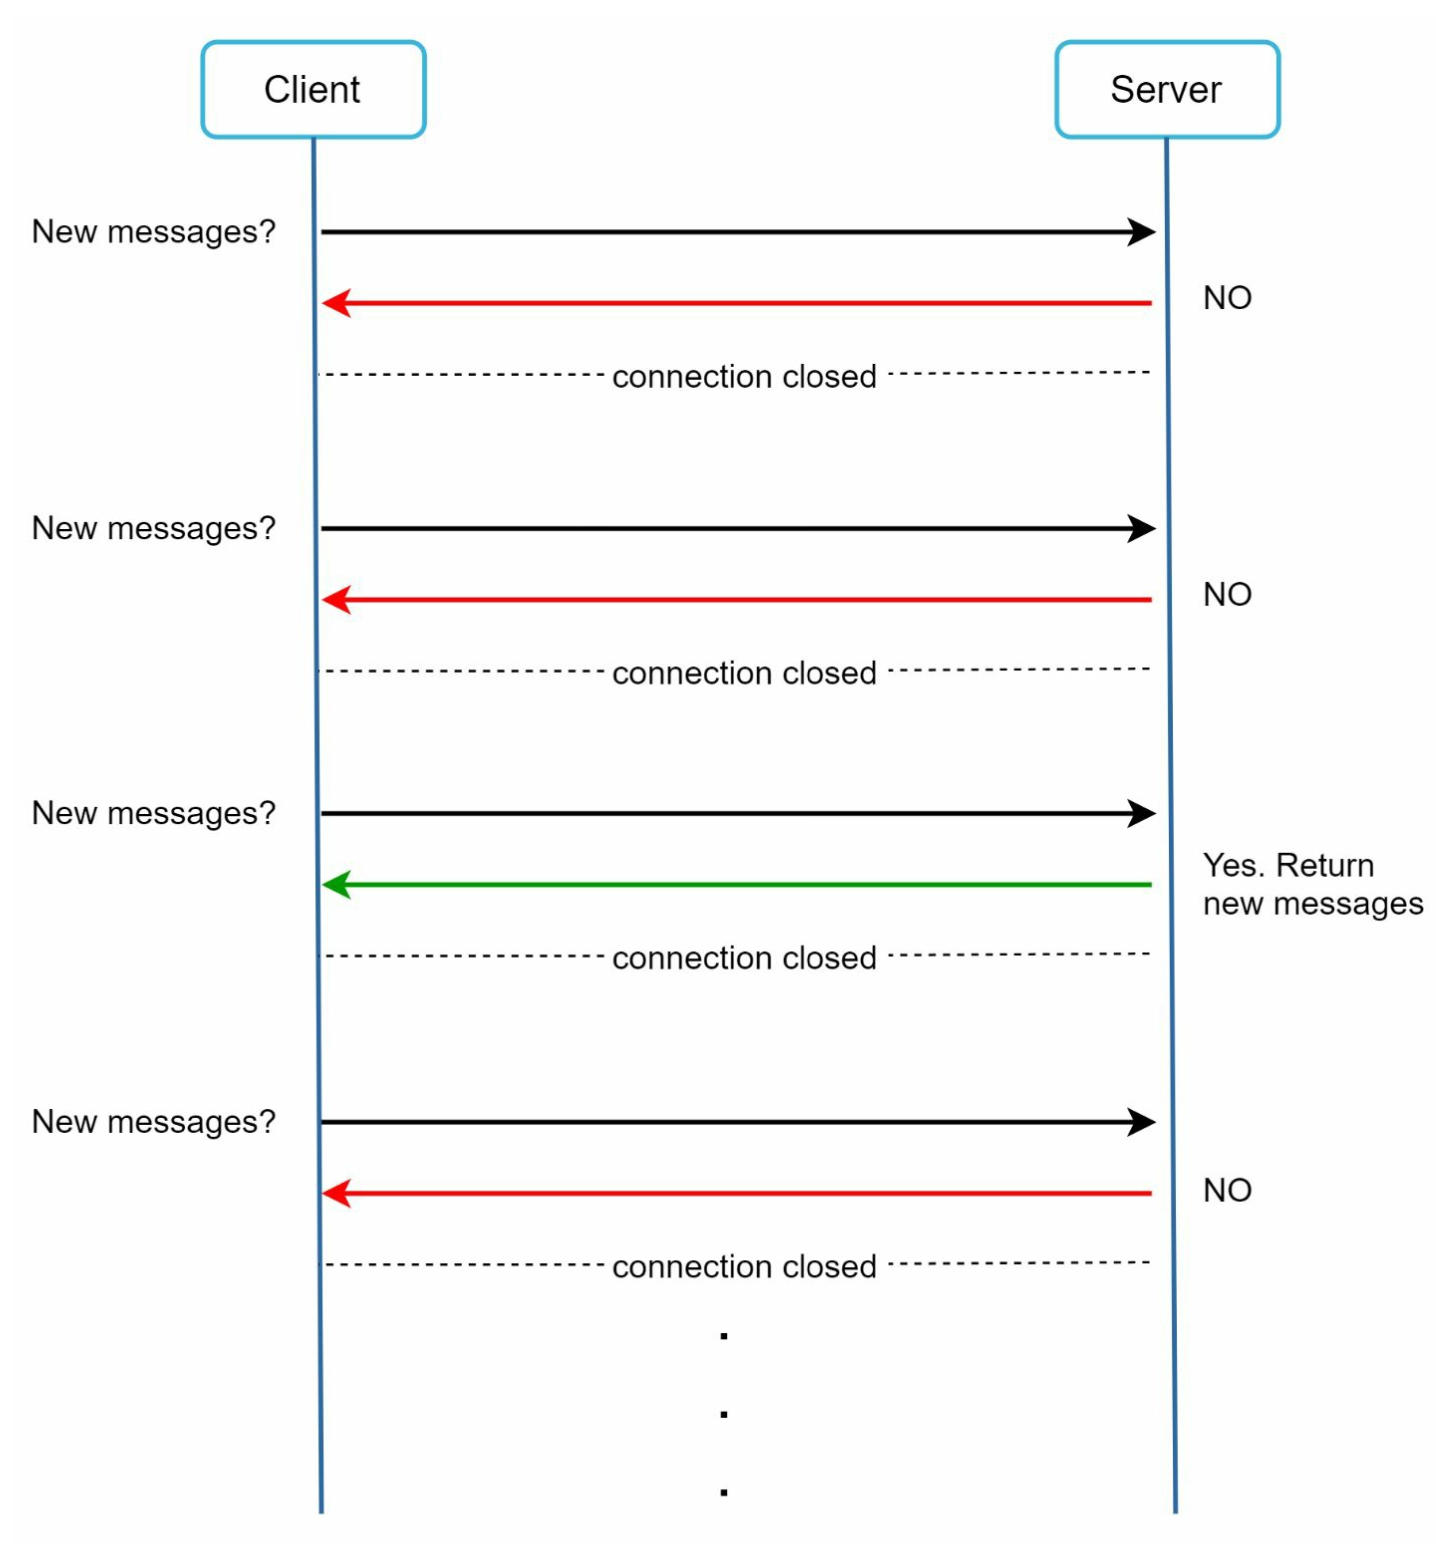
Polling:
Client periodically asks the server if there are messages available.
Inefficient due to frequent, redundant requests.
Redrawn · diagram-design
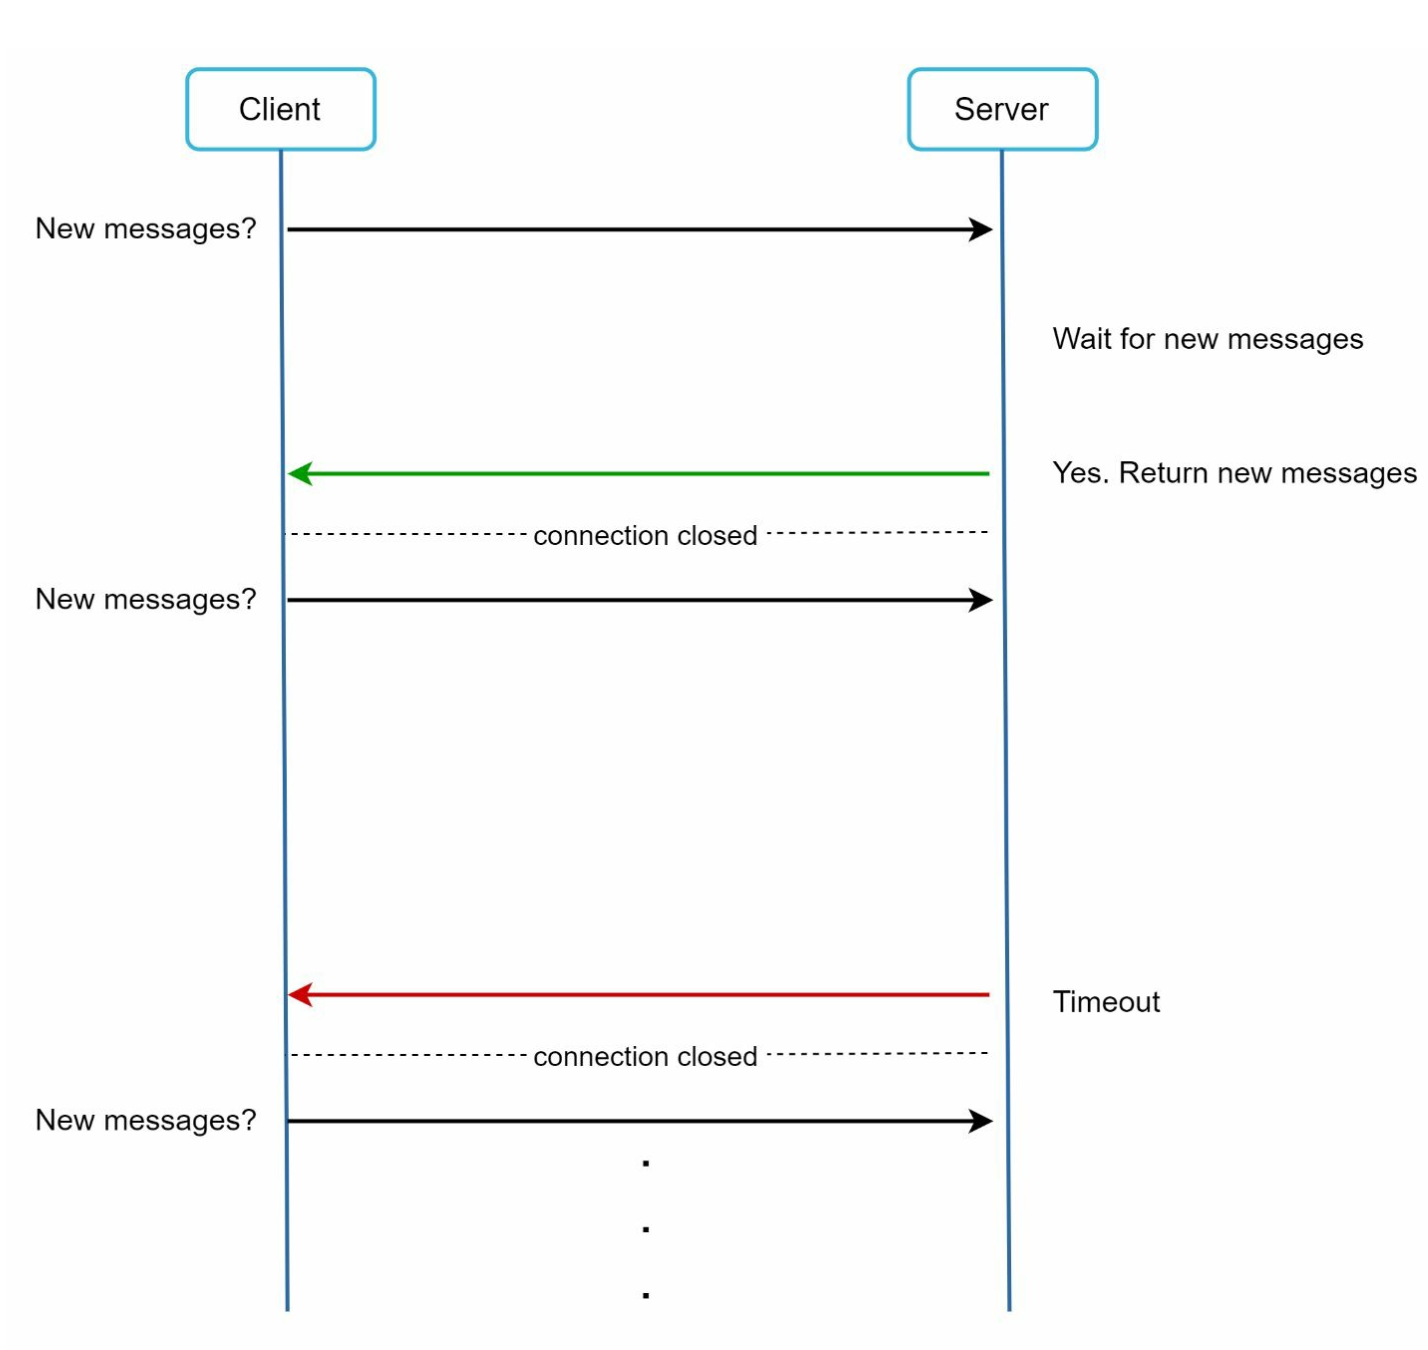
Long Polling:
Keeps the connection open until messages arrive.
Inefficient for inactive users.
Redrawn · diagram-design
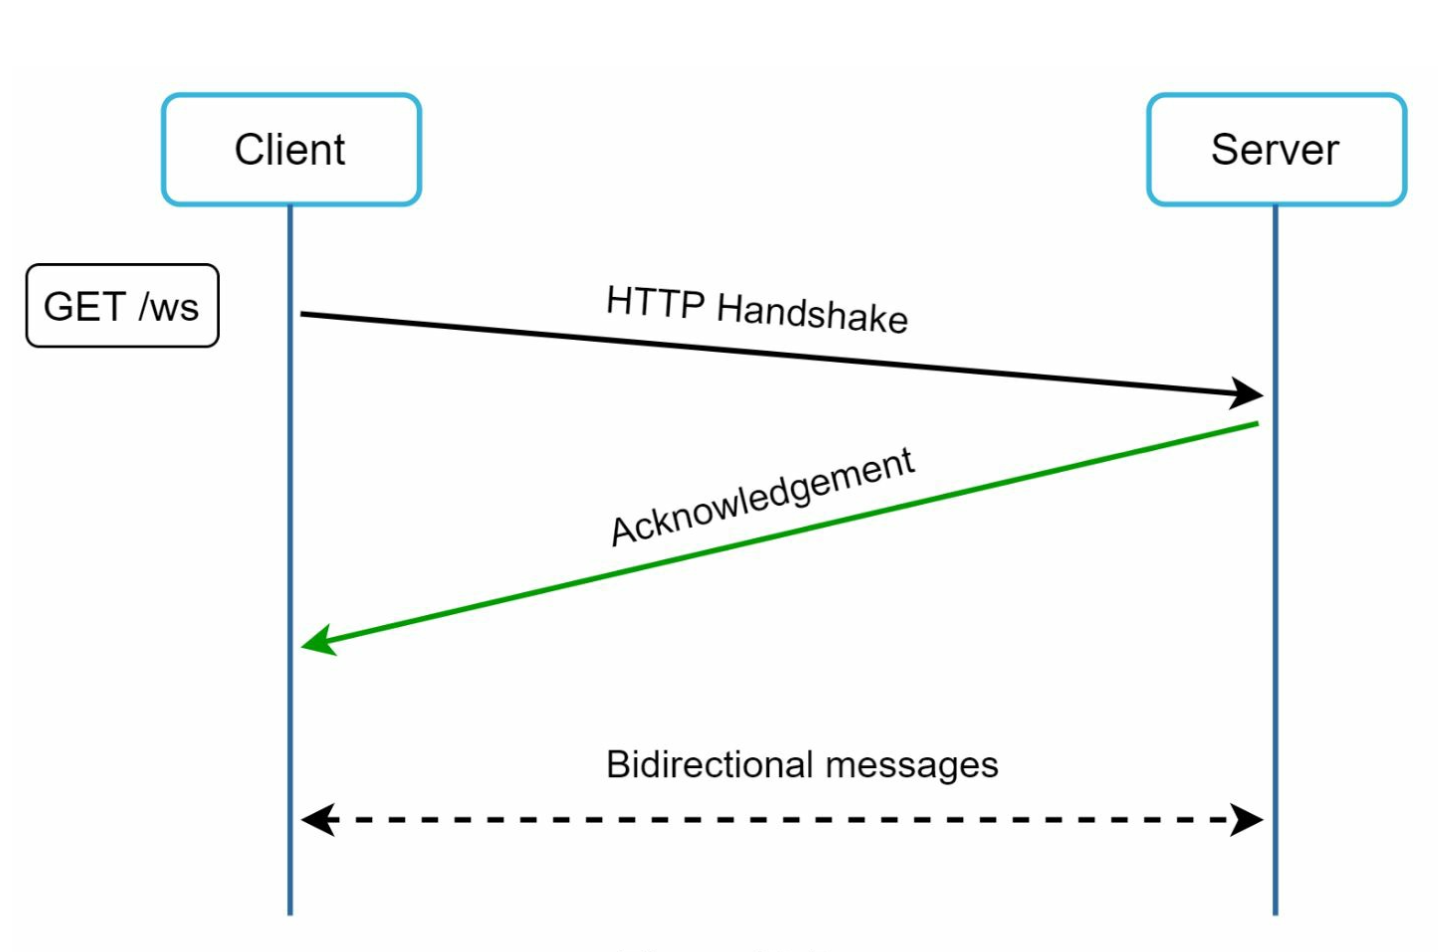
WebSocket:
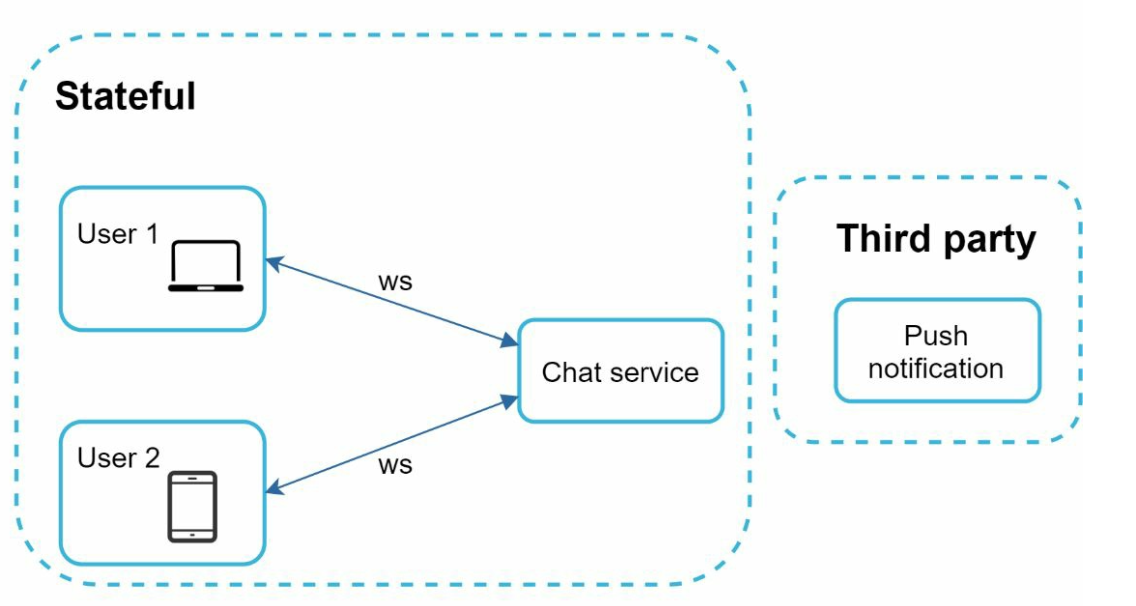
A bi-directional, persistent connection for real-time communication, chosen for both sending and receiving messages.
Uses WebSockets (ws) protocol for sending and recieving messages.
Redrawn · diagram-design
Components
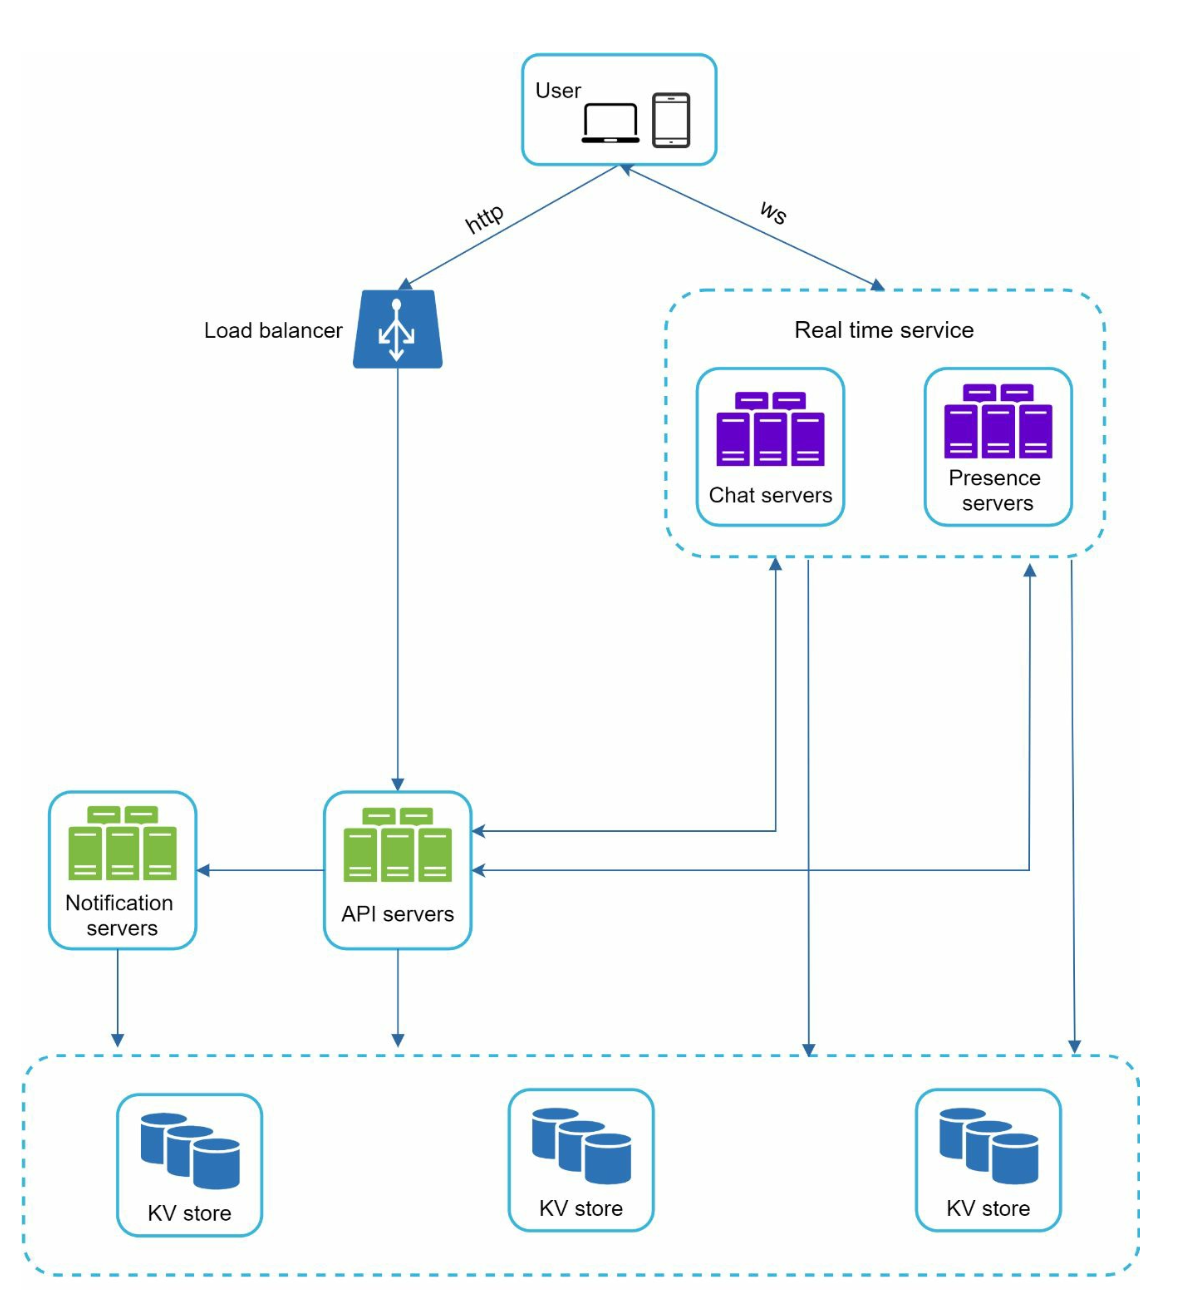
Redrawn · diagram-design
Redrawn · diagram-design
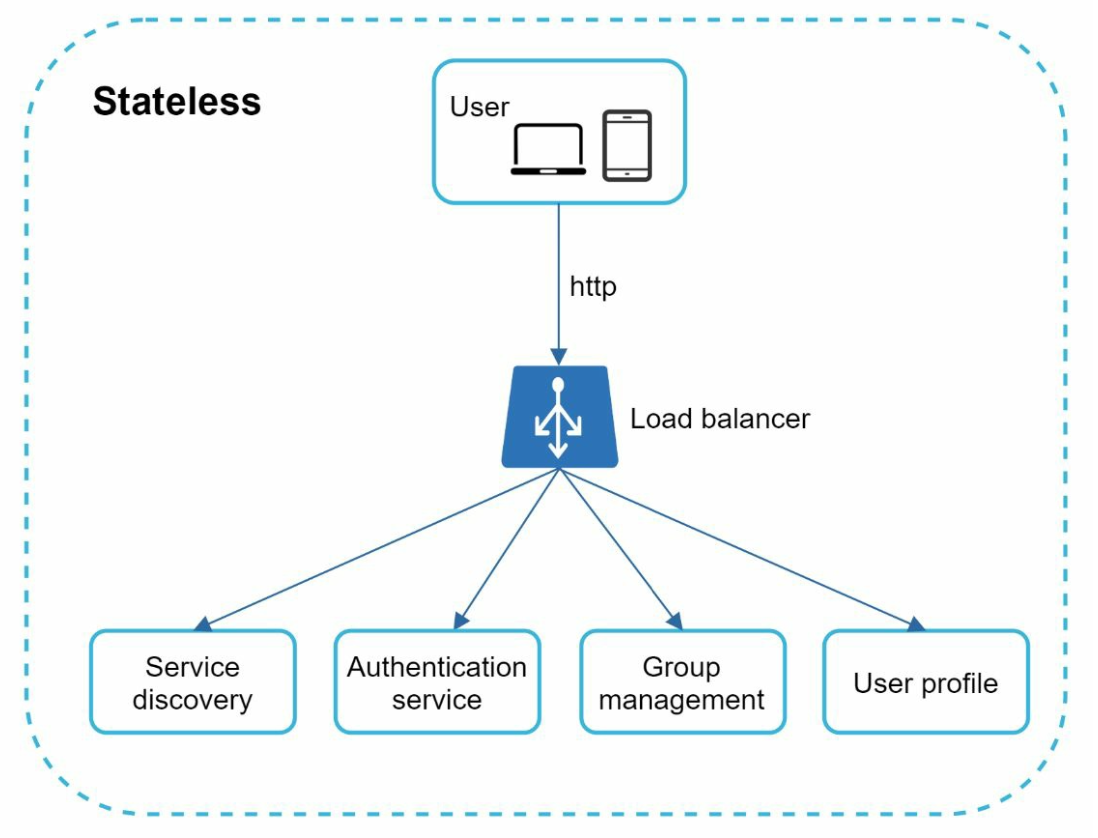
Stateless Services:
Handle signup, login, and user profile management.
Integrated with service discovery to recommend the best chat server.
API servers handle everything including user login, signup, change profile, etc.
Notification servers send push notifications.
Finally, the key-value store is used to store chat history.Key-value stores for the database of the chat history data for following reasons:
It allows easy horizontal scaling.
KV stores provide very low latency to access data.
Relational databases do not handle long tail of data well. When the indexes grow
large, random access is expensive.
KV stores are adopted by other proven reliable chat applications. For example,
both Facebook messenger and Discord.
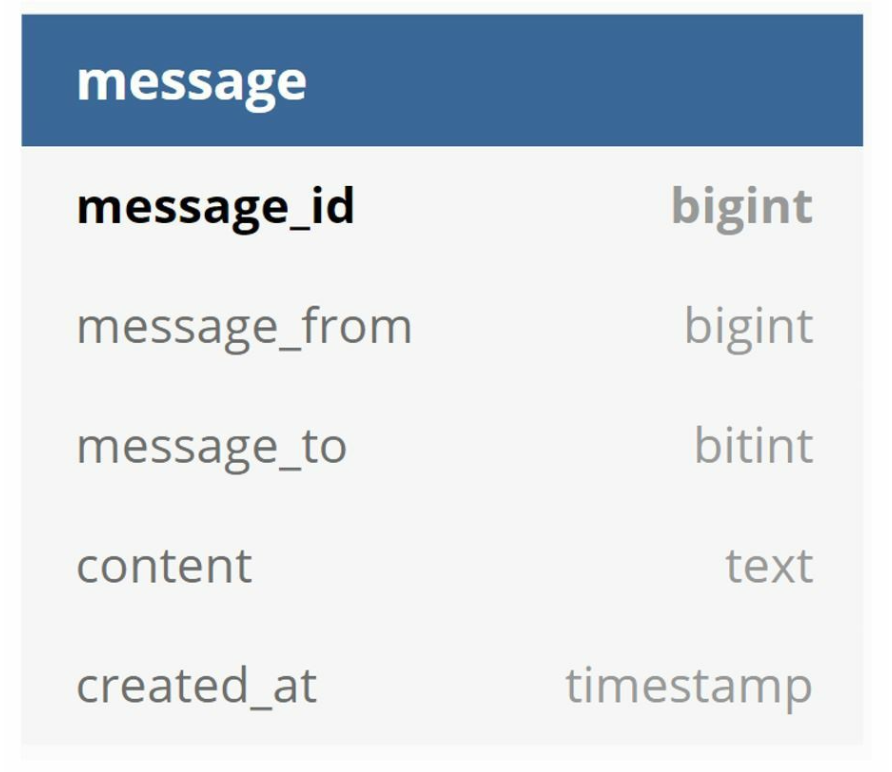
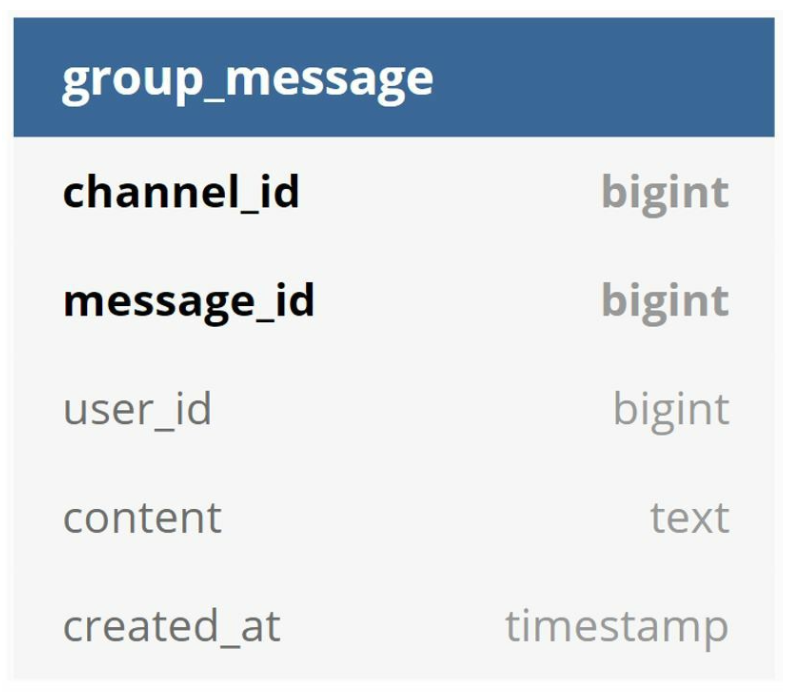
Following are the data models for one-to-one chat and group chat.
The primary key is message id, which helps to decide message sequence.
For the group chat the composite primary key is (channel_id, message_id).
IDs can be generated using a global 64-bit sequence number generator like Snowflake.
A better approach is to use local sequence number generator. Local means IDs are only unique within a group.
The reason why local IDs work is that maintaining message sequence within one-on-one channel or a group channel is sufficient.
Redrawn · diagram-design
Redrawn · diagram-design
Step 3: Design Deep Dive
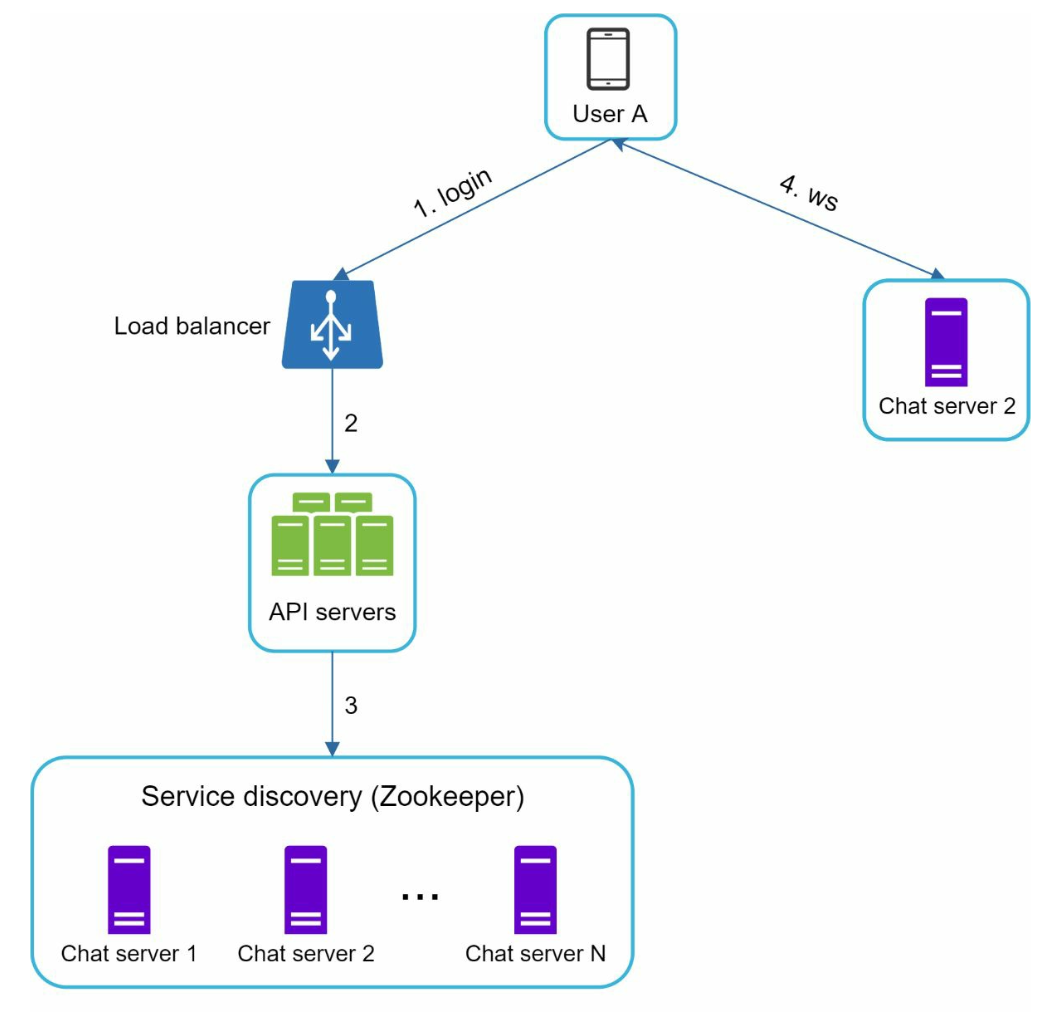
Service Discovery
Redrawn · diagram-design
The primary role of service discovery is to recommend the best chat server for a client based
on the criteria like geographical location, server capacity.
Uses Apache Zookeeper to allocate chat servers based on criteria like geographic location and server capacity.
Ensures efficient load distribution and minimizes latency.
Messaging Flows
One-on-One Chat
User A sends a message to Chat Server 1.
Chat Server 1 assigns a unique message ID and stores the message in a key-value store.
If User B is online, the message is forwarded to Chat Server 2, maintaining a persistent WebSocket connection.
If User B is offline, a push notification is sent.
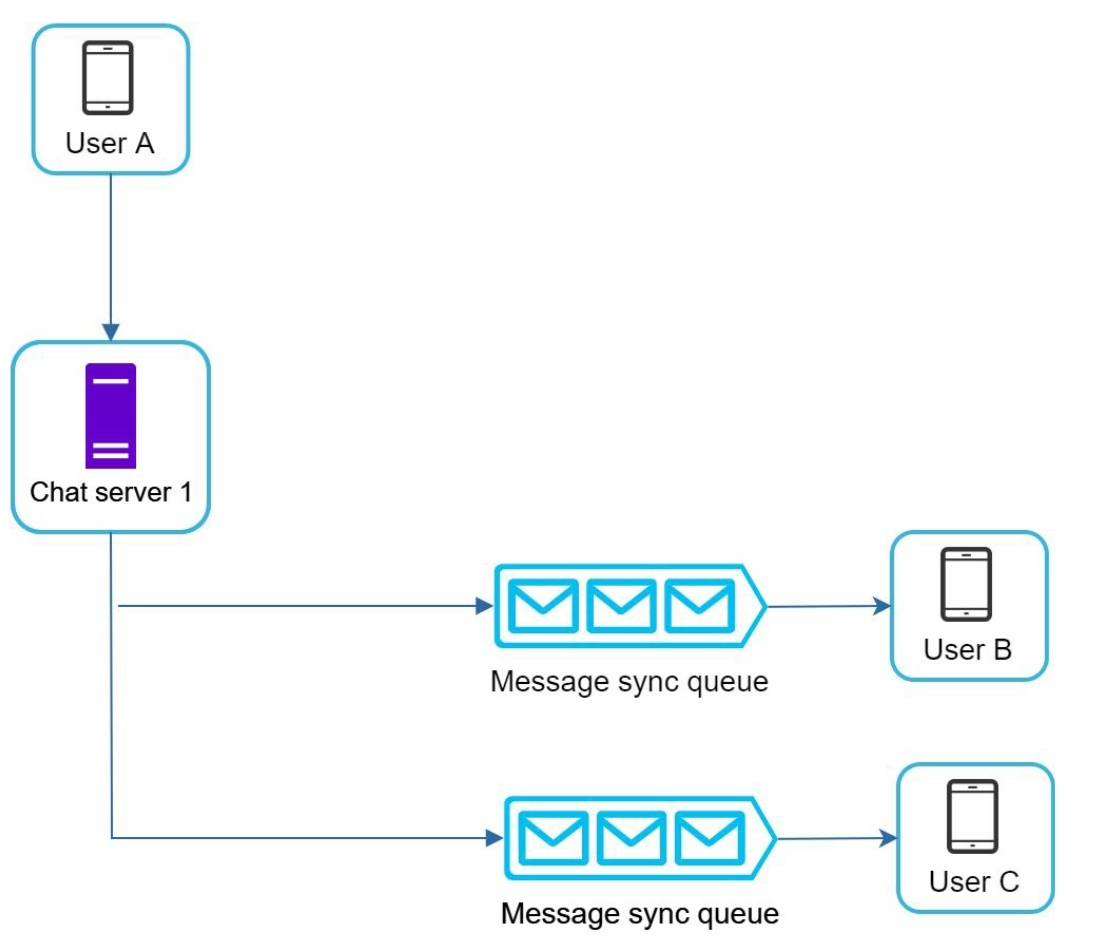
Group Chat
Redrawn · diagram-design
Messages are copied to individual inboxes for each recipient in the group.
Simplifies synchronization but becomes expensive for larger groups.
On the recipient side, a recipient can receive messages from multiple users. Each recipient
has an inbox (message sync queue) which contains messages from different senders.
Message Synchronization
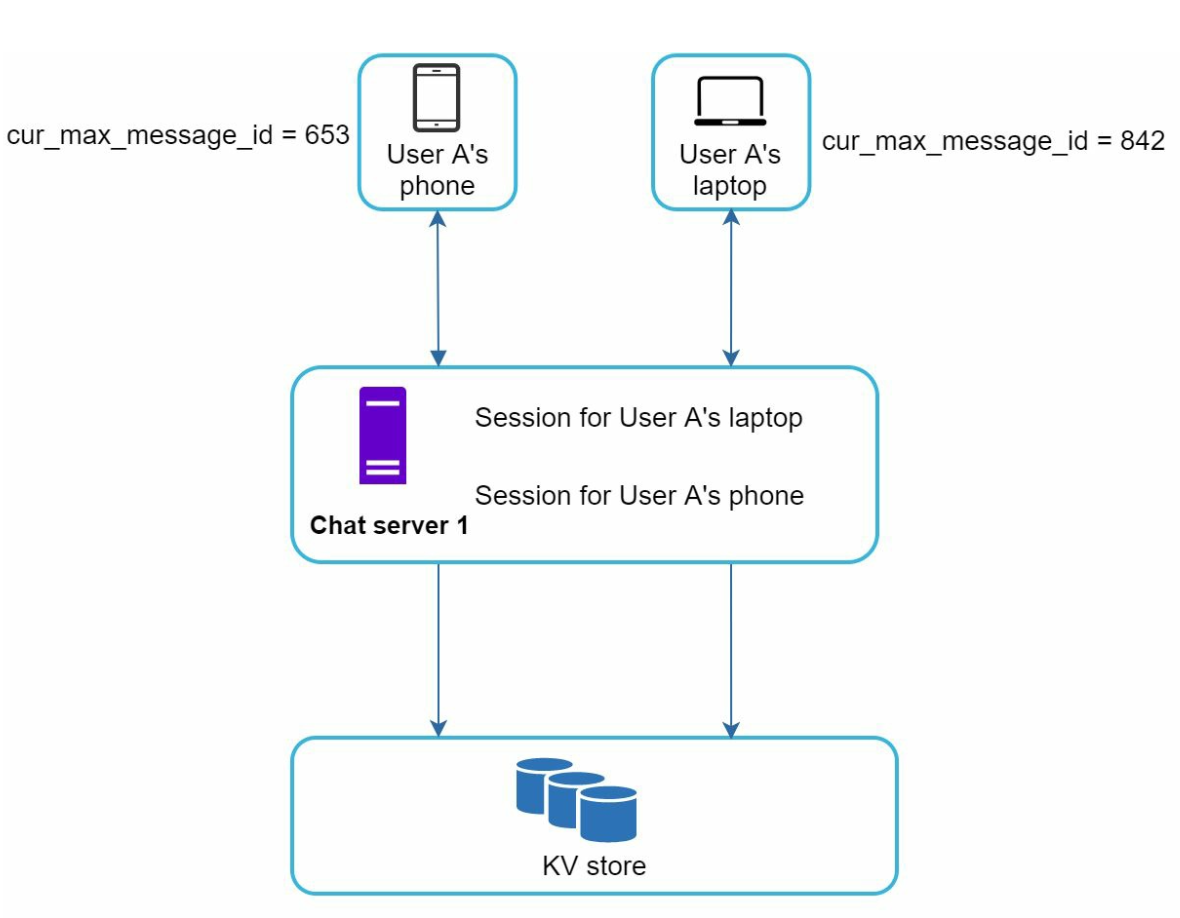
Many users have multiple devices. We need to synchronize the message across the devices.
Each device maintains a variable called cur_max_message_id, which keeps track of the latest
message ID on the device. Messages that satisfy the following two conditions are considered
as news messages:
Redrawn · diagram-design
The recipient ID is equal to the currently logged-in user ID.
Message ID in the key-value store is larger than cur_max_message_id
Online Presence
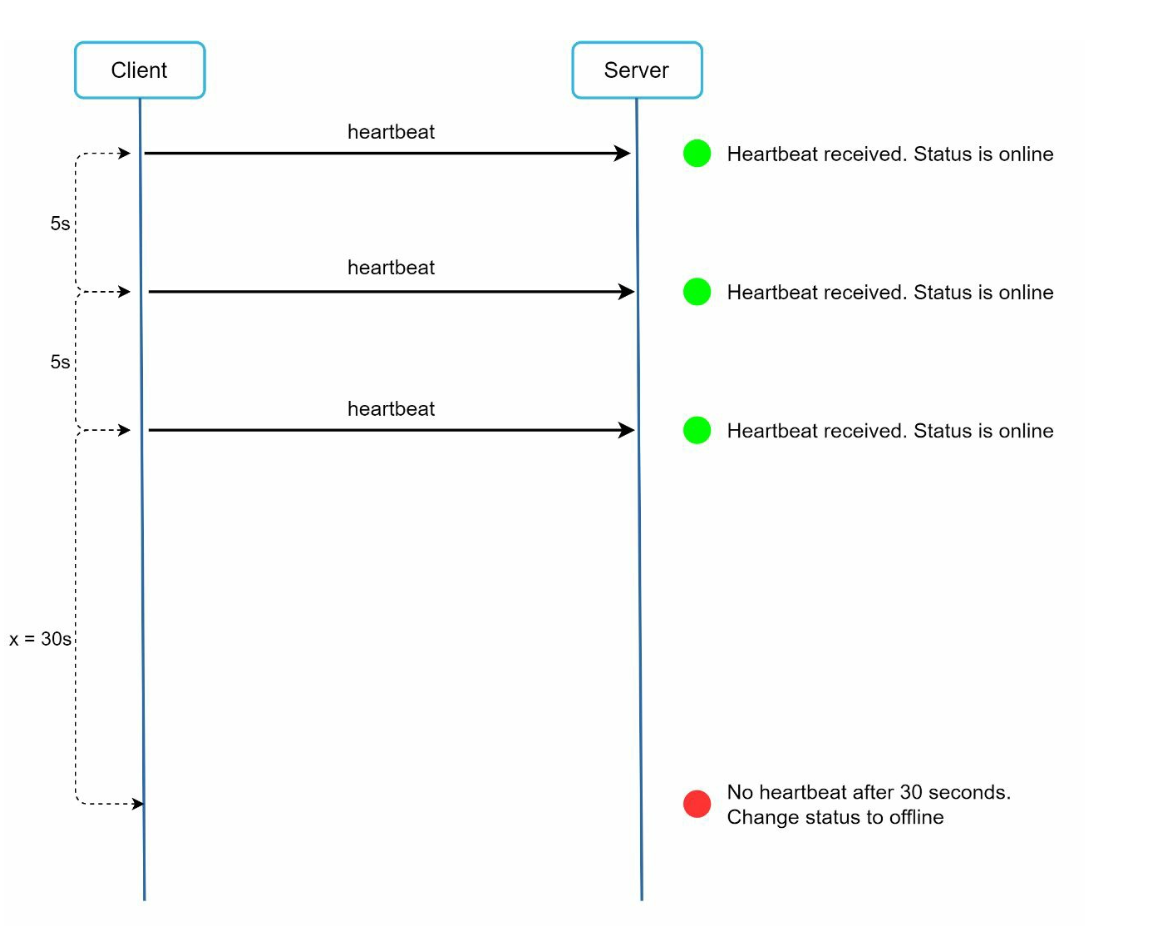
Heartbeat Mechanism:
Redrawn · diagram-design
Clients send periodic heartbeats to presence servers to indicate they are online.
If no heartbeat is received within a threshold (for eg x = 30), the user is marked offline.
Fanout Model:
Redrawn · diagram-design
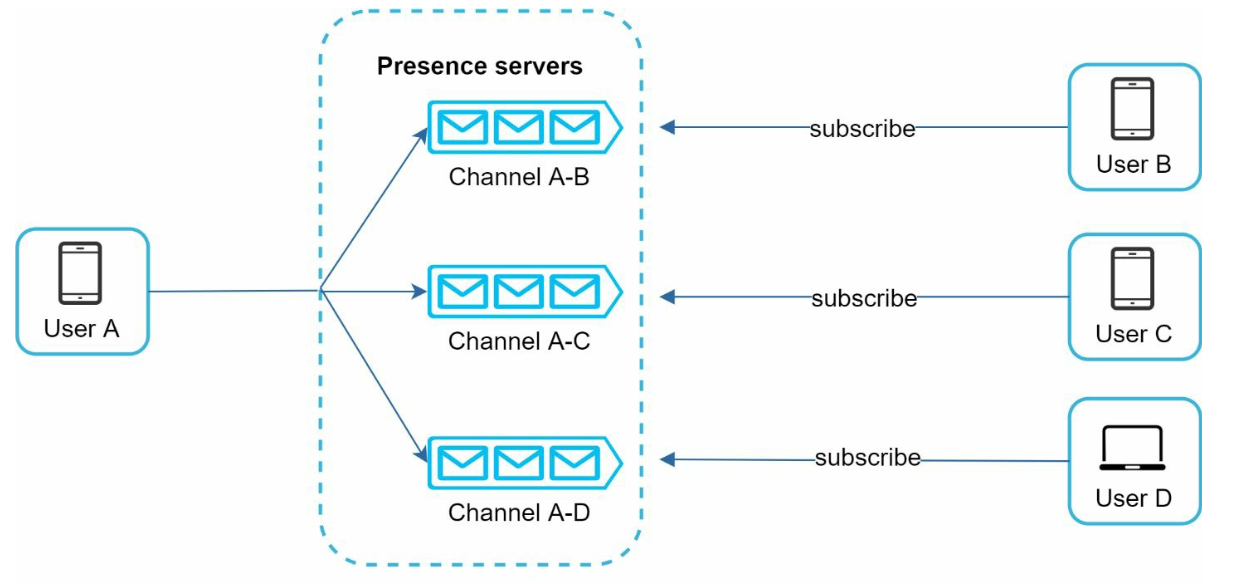
Presence updates are pushed to friends using a publish-subscribe model in which each friend pair maintains a channel.
When User A’s online status changes, it publishes the event to three channels, channel A-B, A-C, and A-D.
Those three channels are subscribed by User B, C, and D, respectively which get the online status updates.
The above design is effective for a small user groups.
Additional Considerations
Scalability
Horizontal Scaling: Add servers as user count increases.
Load Balancing: Distribute traffic evenly across servers.
Caching: Reduce database load and improve latency.
Error Handling
Retry Mechanisms: Handle message delivery failures with retries and queuing.
Server Failures: Use service discovery to allocate new servers in case of failures.
Future Extensions
Media Support: Add handling for photos and videos, including compression and cloud storage.
End-to-End Encryption: Ensure message privacy.
Client-Side Caching: Reduce data transfer for better performance.
Improved Load Times: Use geographically distributed caching networks.
Chapter 13: Design a Search Autocomplete System
Introduction
Autocomplete, also known as typeahead or incremental search, provides real-time suggestions to users as they type in search boxes. The system must efficiently deliver top-k relevant and popular suggestions based on historical query data.
Key Features
Suggest up to 5 autocomplete results.
Based on query popularity (frequency).
Support only lowercase English characters.
Fast response time (<100 ms) and scalable.
Step 1: Understanding the Problem
Requirements
Real-Time Suggestions: Display relevant matches as the user types.
Top-k Results: Return up to 5 results sorted by popularity.
Scalability: Handle 10 million DAU with a peak QPS of 48,000.
High Availability: Handle failures without system downtime.
Data Growth: Support daily storage growth of 0.4 GB for new query data.
Step 2: High-Level Design
At the high-level, the system is broken down into two services:
Data Gathering Service:
Collects user queries and aggregates them for frequency analysis in real-time.
Real-time processing is not practical for large data sets; however, it is a good starting point
Query Service: Provides the top-k suggestions based on the user’s input.
Data Gathering Service
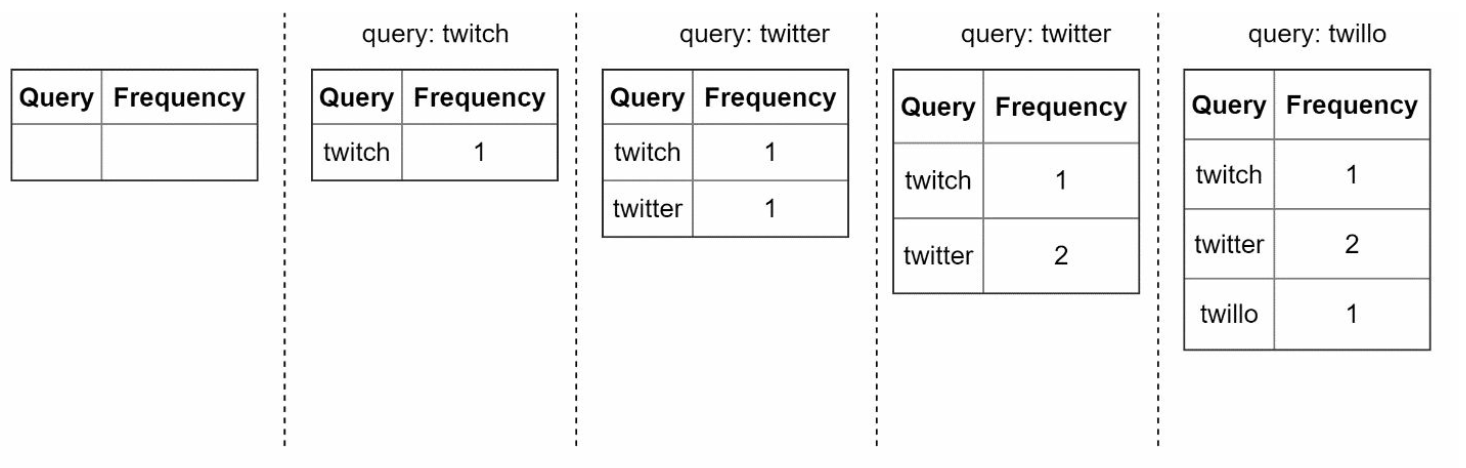
Redrawn · diagram-design
Aggregates query data from analytics logs and updates the frequency table.
Processes historical data weekly to build a trie (prefix tree).
Query Service
Redrawn · diagram-design
Redrawn · diagram-design
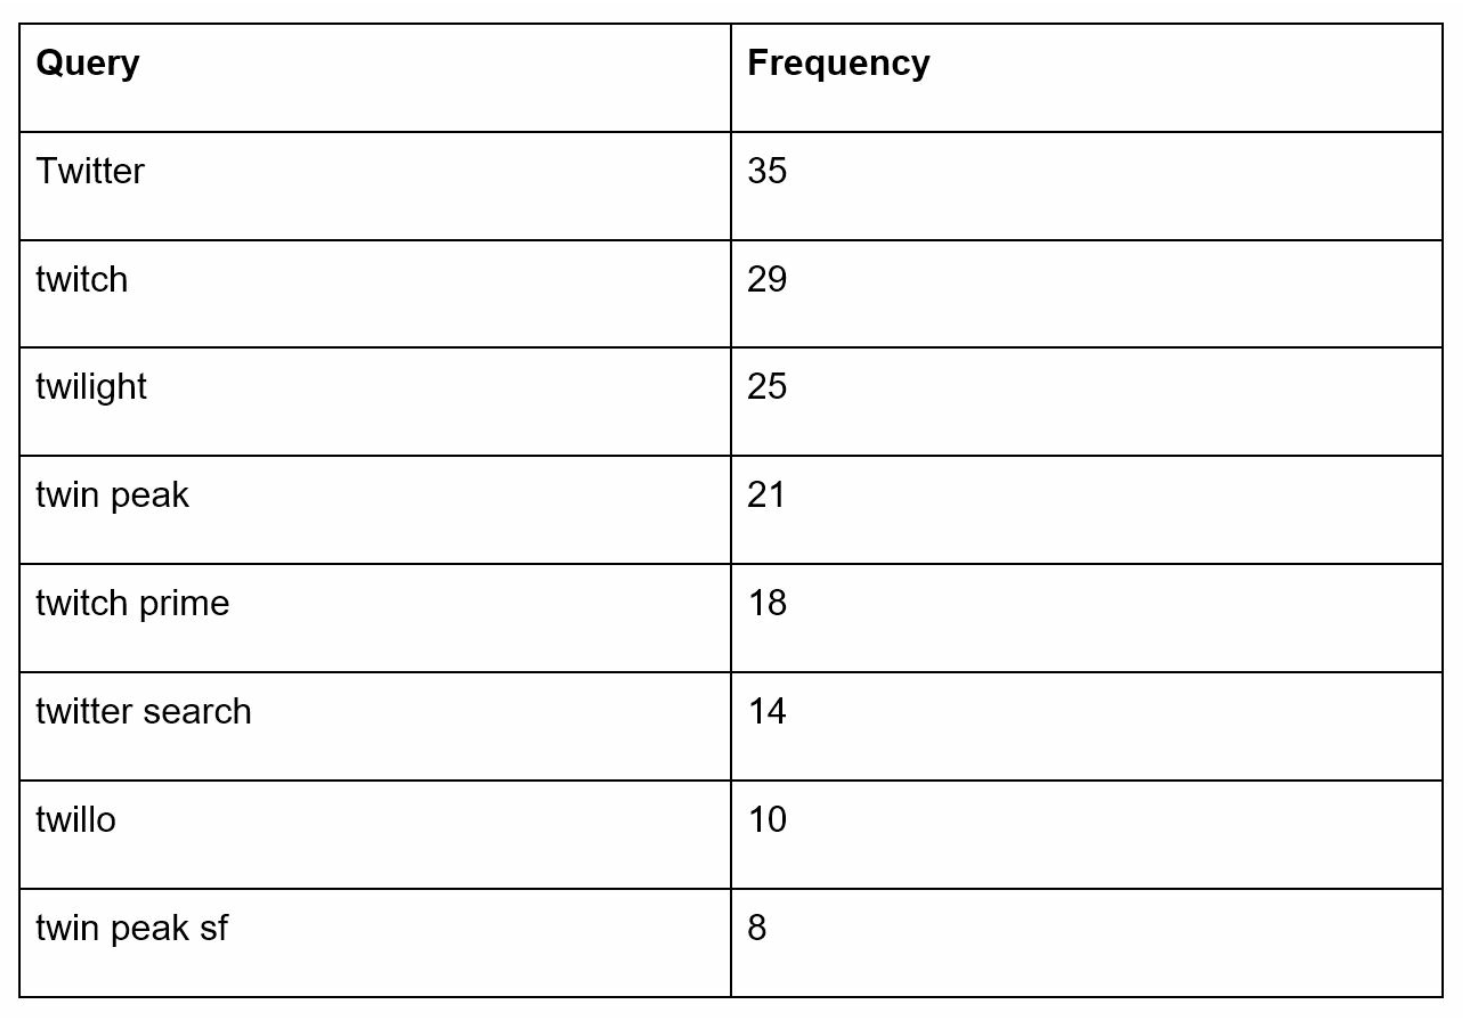
Uses the frequency table from data gathering service.
Processes user input and retrieves top-k suggestions from the frequency table using a Trie.
Optimized for fast lookups using caching and efficient data structures.
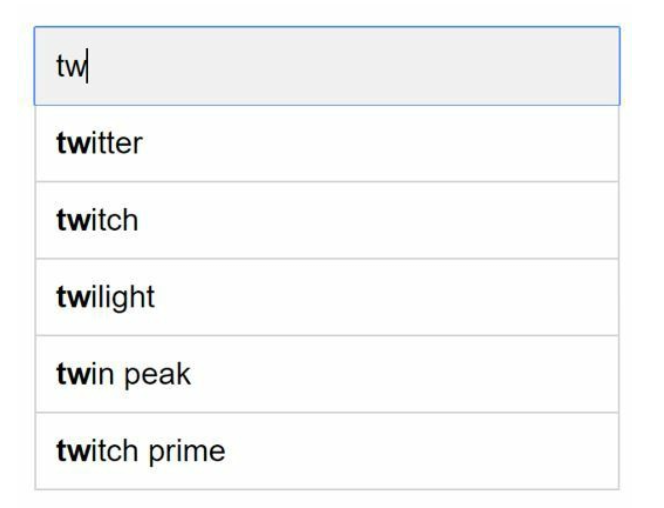
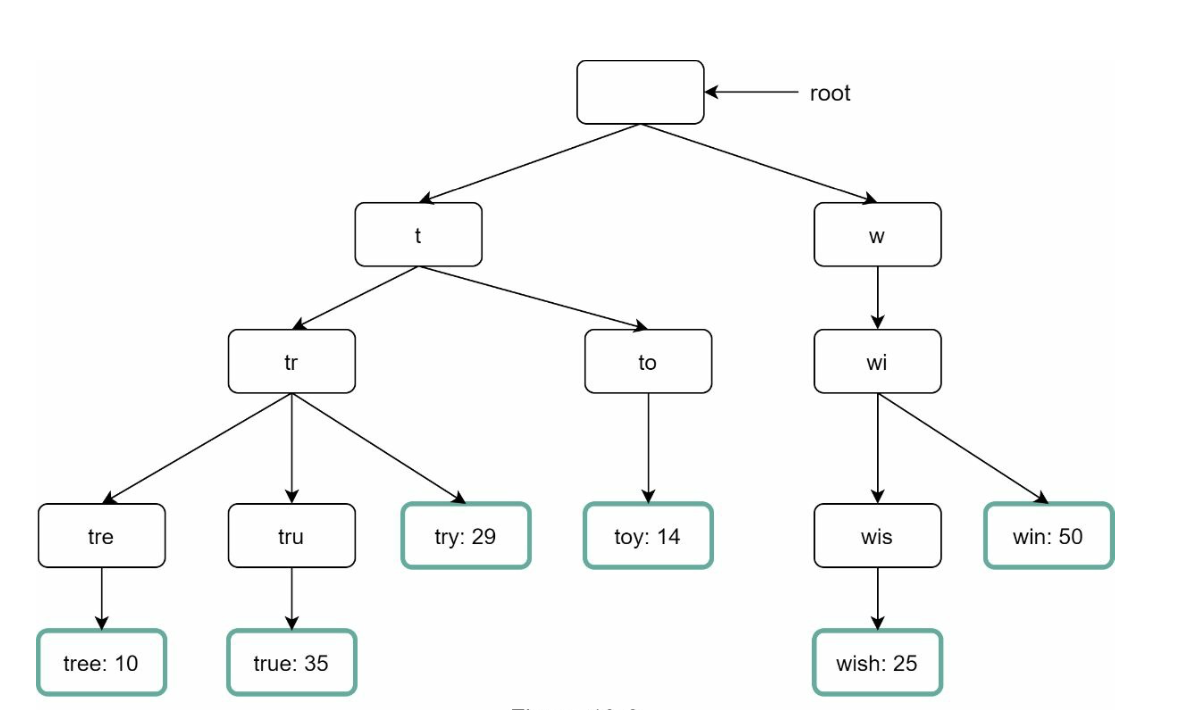
For example when a user types “tw” in the search box, the following top 5 searched queries are displayed.
Step 3: Design Deep Dive
Trie Data Structure
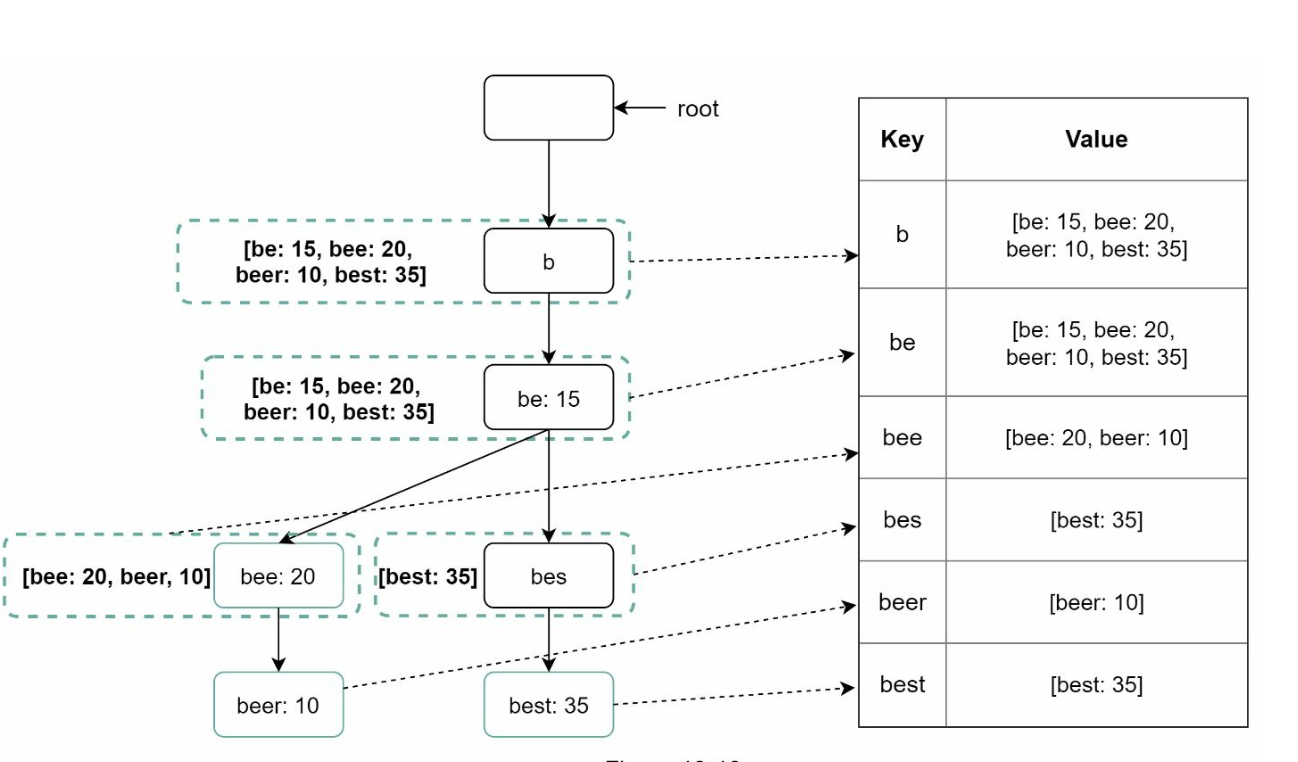
The trie is a tree-like data structure used to store and retrieve query strings efficiently.
Key Features
Compact Storage: Represents prefixes hierarchically to minimize redundancy.
Frequency Information: Stores the popularity of queries at each node.
Steps to get top k most searched queries
Redrawn · diagram-design
Find the prefix
Traverse the subtree from prefix node to get all valid children
Sort the children and get top k
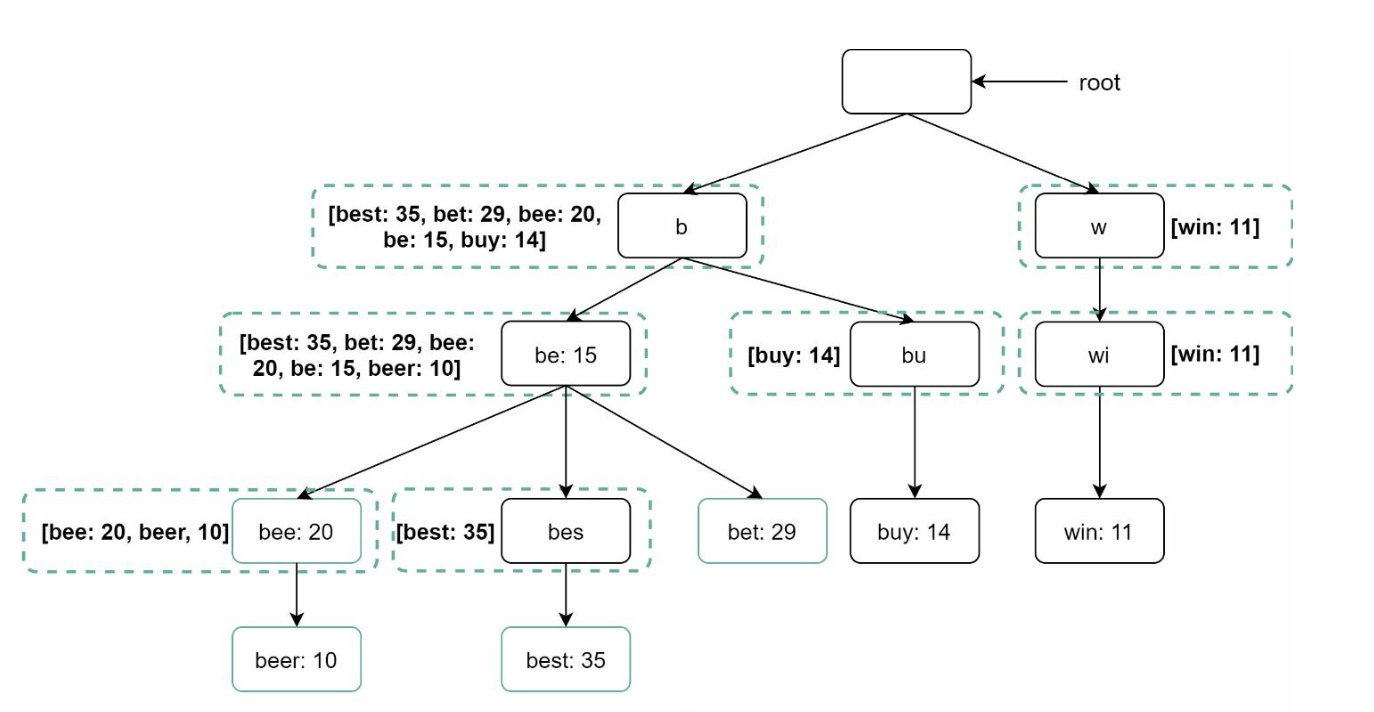
Optimizations:
Cache top-k queries at each node to speed up retrieval and avoid traversing the whole trie.
Redrawn · diagram-design
Limit prefix length to reduce search space as users rarely type a loong search query (say 50).
Trie Operations
Create:
Built weekly using aggregated query data.
The source of data is from Analytics Log/DB.
Update: Rarely updated in real-time; weekly updates replace old data.
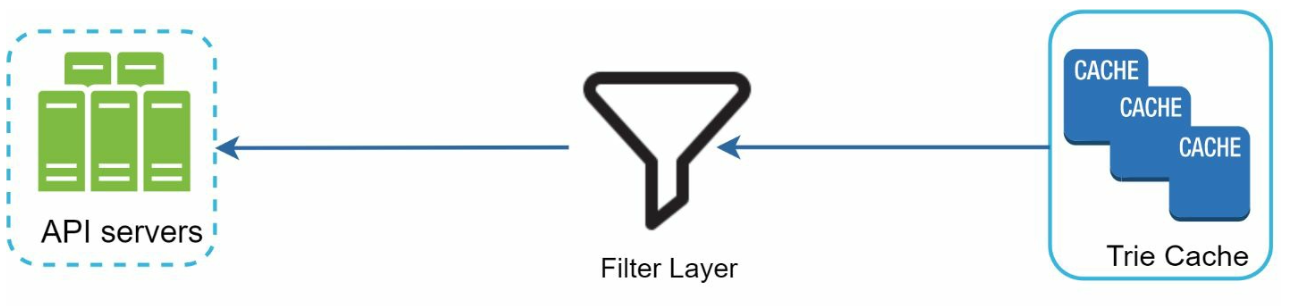
Delete:
Redrawn · diagram-design
Filters remove unwanted or harmful suggestions (e.g., hate speech).
Having a filter layer gives us the flexibility of removing results based on different filter rules.
Unwanted suggestions are removed physically from the database asynchronically.
Query Processing Flow
Prefix Search:
Identify the prefix node corresponding to the user’s input.
Traverse the subtree to collect valid suggestions.
Top-k Sorting:
Cache top-k suggestions at each node to minimize sorting overhead.
Response Construction:
Construct results using cached data for fast response times.
Optimizations
Cache at Each Node:
Store the top-k queries to avoid redundant traversals.
Limit Prefix Length:
Cap prefix length to a small value (e.g., 50 characters) for faster lookups.
AJAX Requests:
Use lightweight asynchronous requests for real-time responses.
Browser Caching:
Save autocomplete results in the browser cache for frequently searched terms.
Data Gathering Pipeline
In the high-level design, whenever a user types a search query, data is updated in real-time. This appraoch is not practical.
Users may enter billions of queries per day. Updating the trie on every query is not feasible.
Top suggestions may not change much one the trie is built.
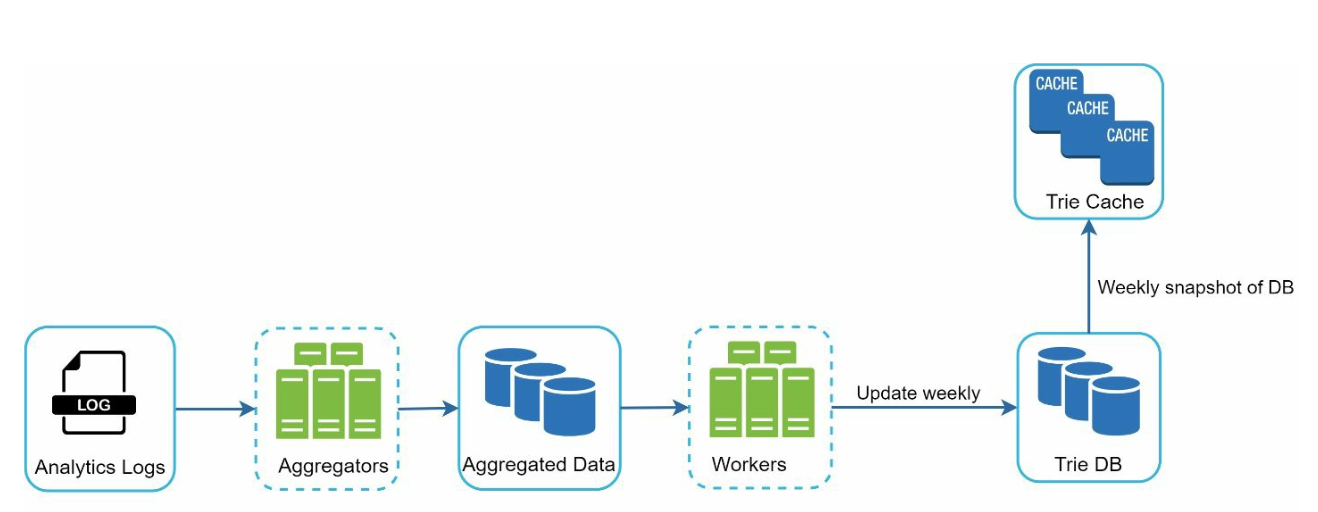
Updated Design
Redrawn · diagram-design
Analytics Logs:
Stores raw query data as logs for weekly aggregation.
Logs are append-only and are not indexed
Aggregators:
Process logs into frequency tables, suitable for trie construction.
For real-time applications such as Twitter, aggregate data in a shorter time interval.
For other cases, aggregating data less frequently, say once per week is good enough.
Workers:
Asynchronous servers rebuild the trie and store it in persistent storage.
Storage Options:
Trie Cache: Trie Cache is a distributed cache system that keeps trie in memory for fast read.
Trie DB
Document Store (e.g., MongoDB): Since a new trie is built weekly, we can periodically take a snapshot of it, serialize it, and store the serialized data in the database like MongoDB
Key-Value Store:
Maps prefixes to node data for fast access.
Every prefix in the trie is mapped to a key in a hash table.
Data on each trie node is mapped to a value in a hash table.
Redrawn · diagram-design
Scalability
Sharding:
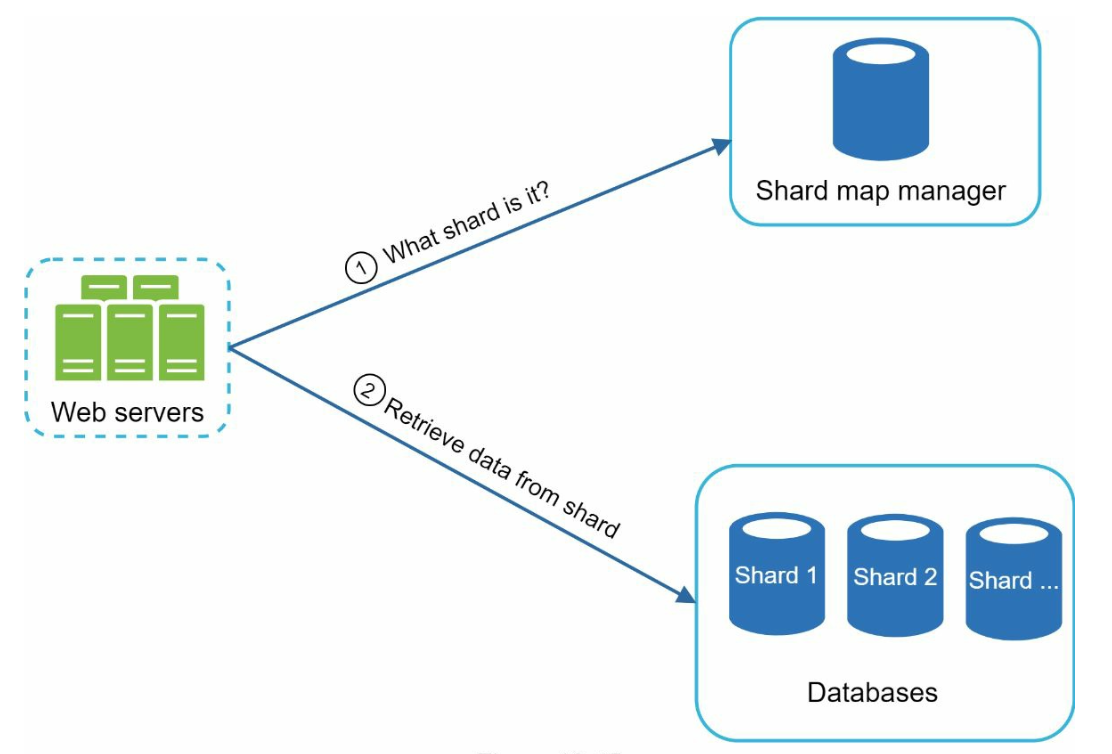
Distribute trie nodes across servers based on prefix ranges (e.g., a-m, n-z).
Further shard within prefixes to balance uneven distributions (e.g., aa-ag, ah-an).
Load Balancing:
Redrawn · diagram-design
Use a shard map manager to route requests to the appropriate server.
Step 4: Advanced Features
Multi-Language Support
Unicode Characters: Use Unicode to support non-English languages.
Country-Specific Tries: Build separate tries for different countries or regions.
Trending Queries
Handle real-time events by dynamically updating trie nodes or weighting recent queries more heavily.
Chapter 14: Design YouTube
Introduction
YouTube is a massive video streaming platform supporting video uploads, playback, and various interactions. This chapter focuses on designing a scalable video streaming system with the following core features:
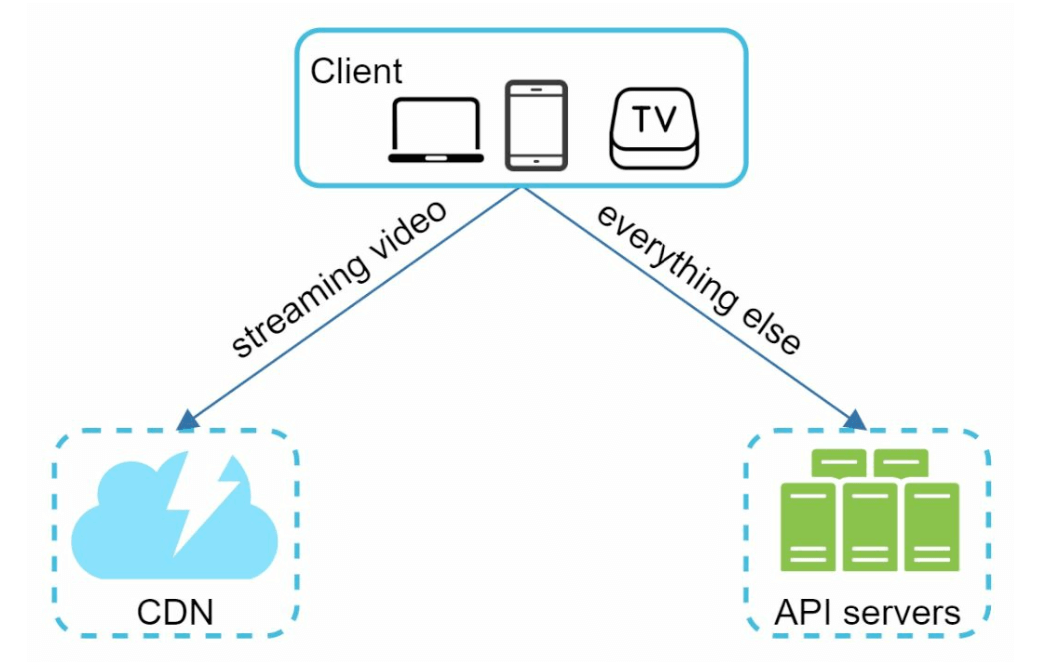
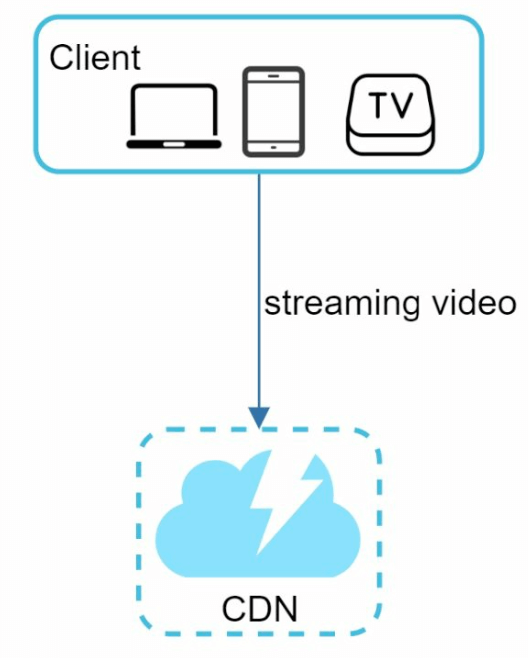
Client: Devices like smartphones, computers, and TVs.
CDN (Content Delivery Network): Stores and streams videos.
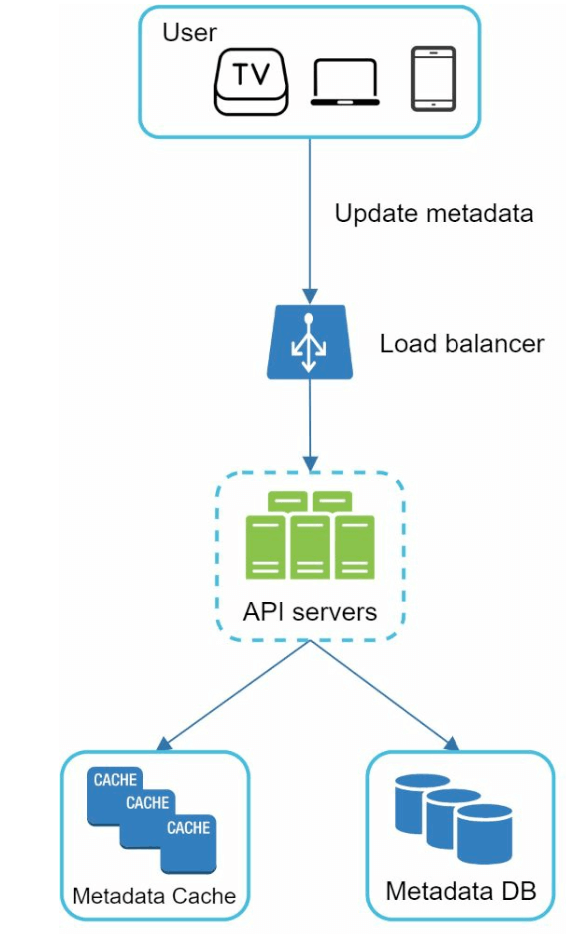
API Servers: Handles all user interactions except video streaming (e.g., uploads, metadata updates).
Metadata Database: Stores video metadata (e.g., title, description, size).
Original Storage: Blob storage for uploaded videos.
Transcoding Servers: Convert videos into multiple resolutions and formats.
Transcoded Storage: Blob storage for transcoded videos.
Core Workflows
1. Video Uploading Flow
Parallel Processes:
Upload video to original storage.
Update video metadata in the database.
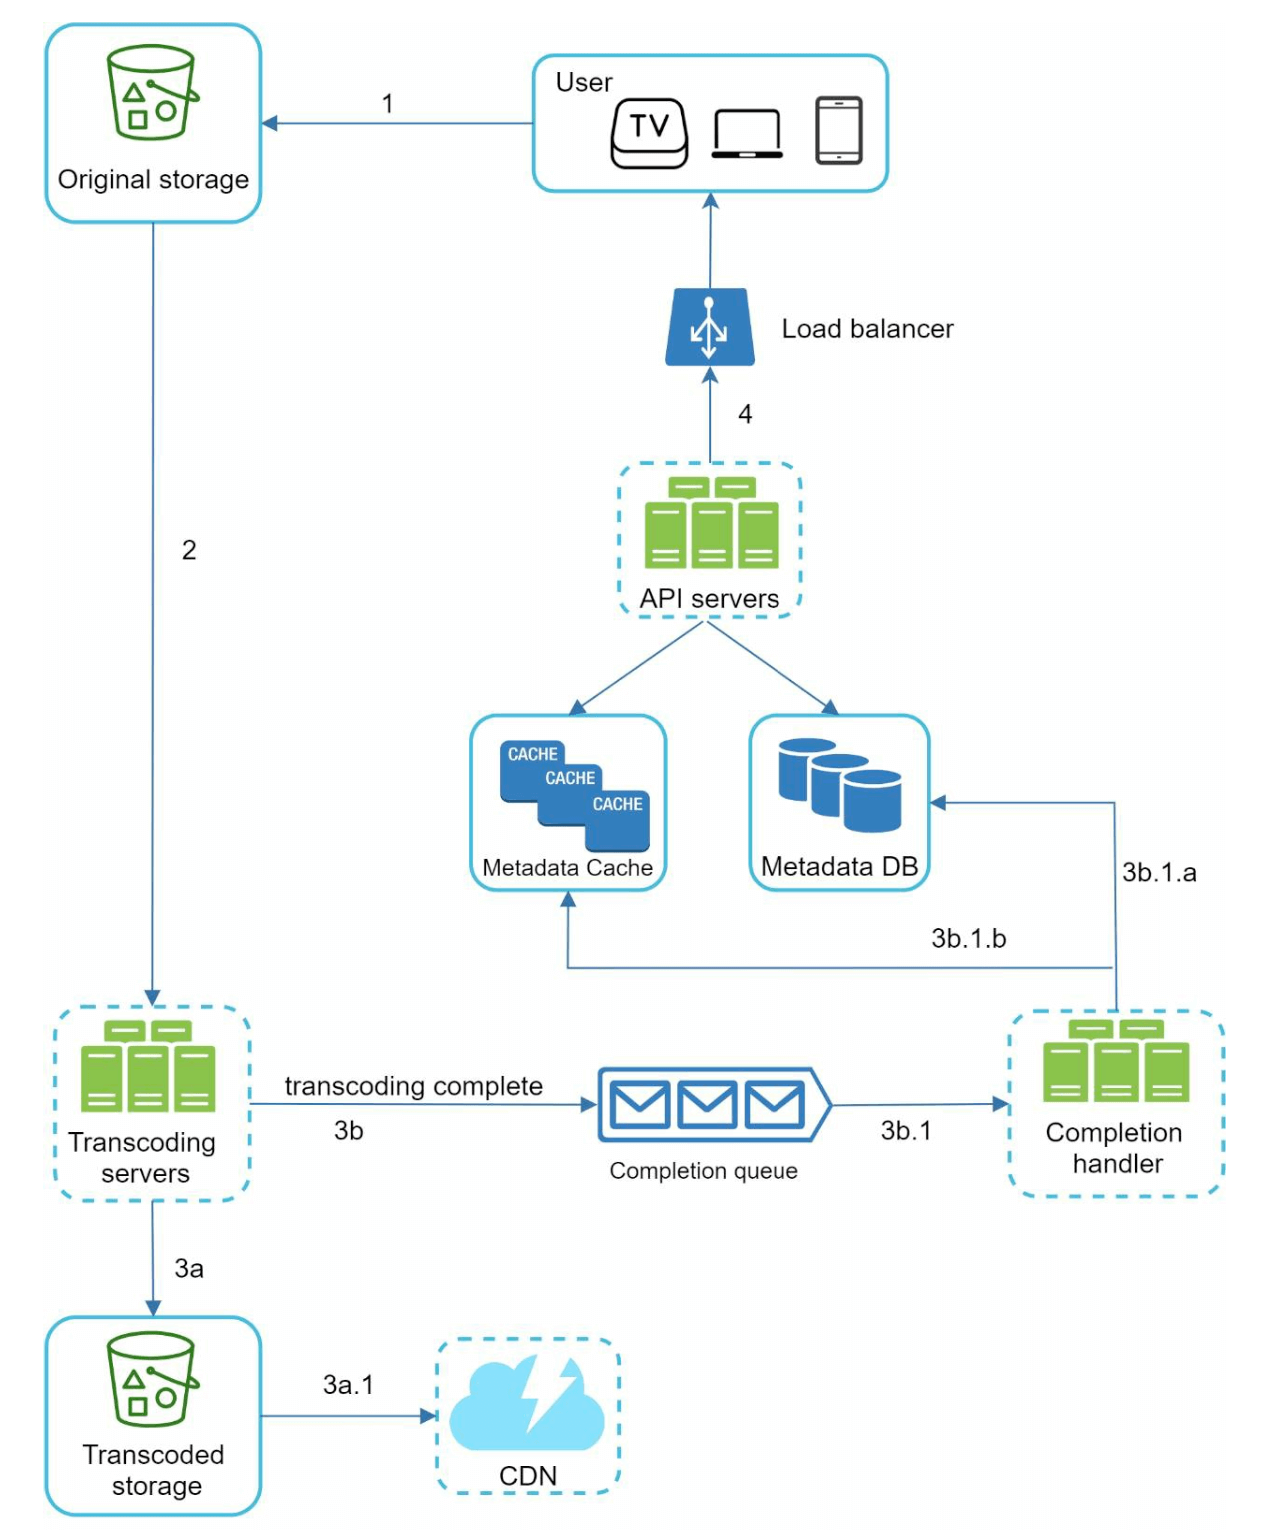
Video Upload (Steps):
Redrawn · diagram-design
[1] Videos are uploaded to blob storage.
[2] Transcoding servers convert videos to multiple formats.
[3] One trasncoding is complete, following two steps are exectued in parallel.
[3a] Transcoded videos are sent to transcoded storage.
[3b] Transcoding completion events are queued in the completion queue.
[3a.1] Videos are distributed to the CDN.
[3b.1] Completion handlers update metadata and inform users.
Metadata Upload (Steps):
Redrawn · diagram-design
The client in parallel sends a request to update the video metadata
The request contains video metadata, including file name, size, format, etc.
2. Video Streaming Flow
Redrawn · diagram-design
Videos are streamed directly from the CDN using edge servers to minimize latency.
Some of te popular streaming protocols are MPEG_DASH, Apple HLS, Adobe HDS.
Different streaming protocols support different video encodings and playback players.
Step 3: Design Deep Dive
Video Transcoding
Importance
Raw video consumes large amounts of storage space. It Reduces storage space.
Ensures compatibility across devices and browsers.
Adapts video quality to network conditions.
Components
Container: Encapsulates video, audio, and metadata (e.g., MP4, AVI).
Codecs: Compression and Decompression algorithms (e.g., H.264, VP9).
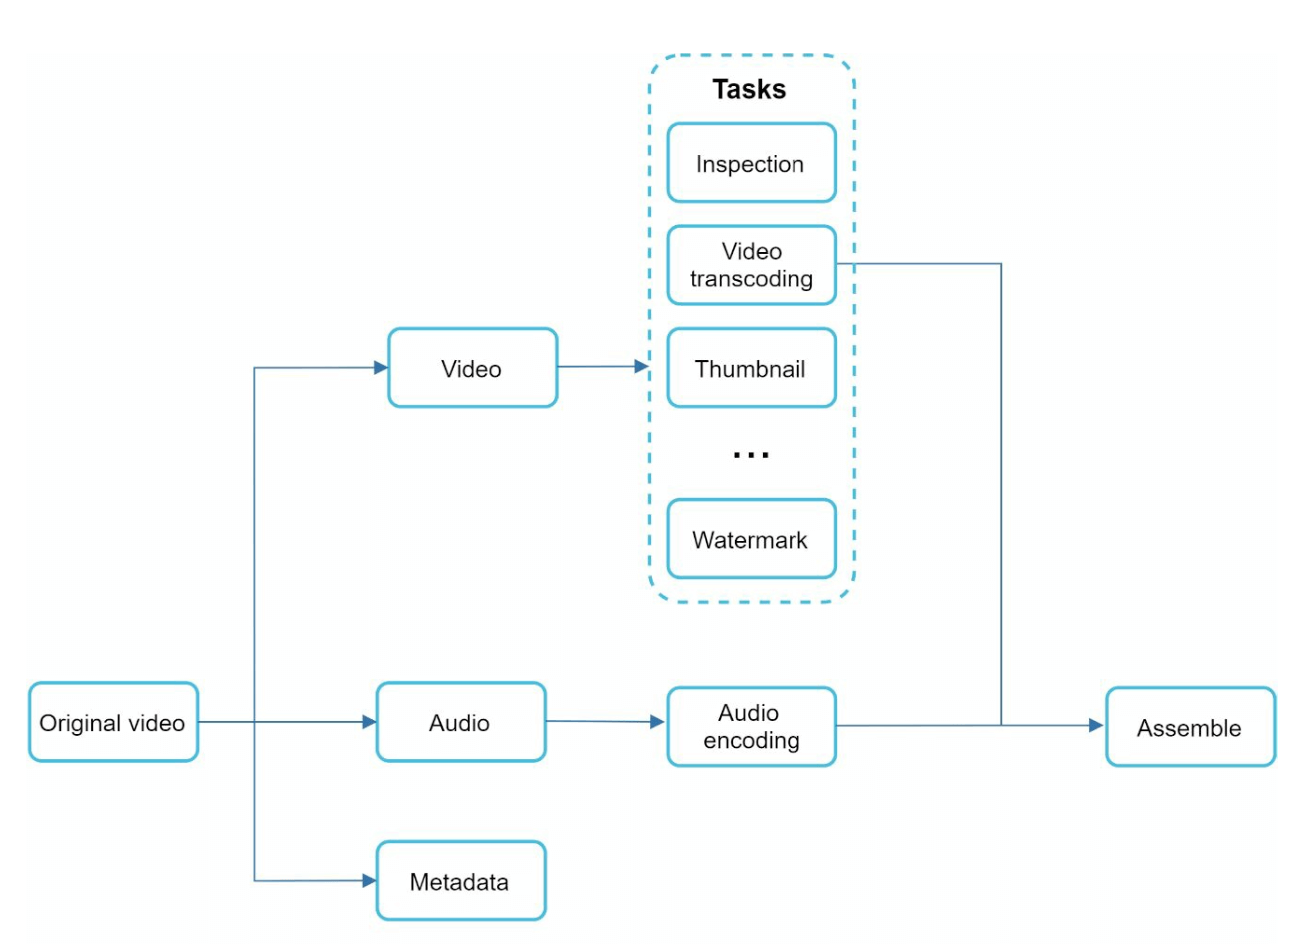
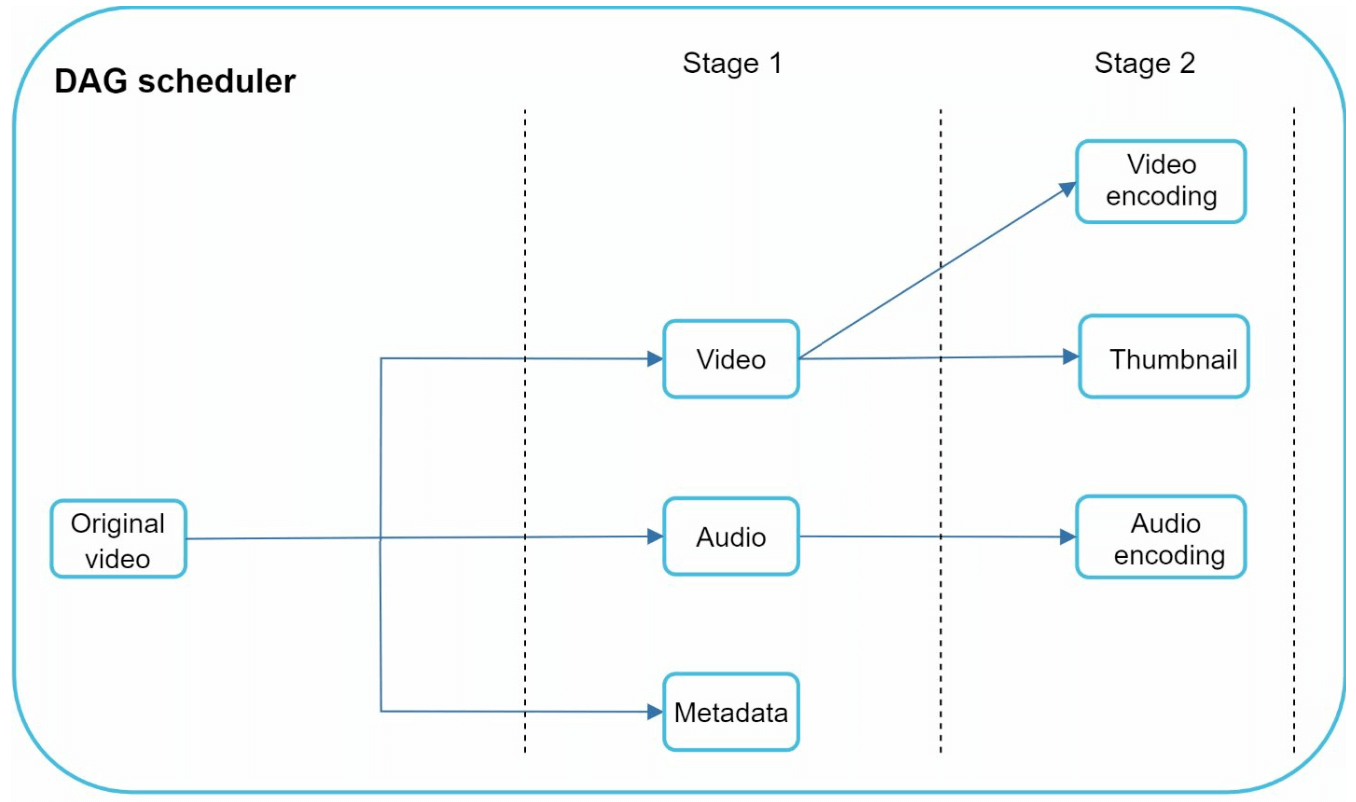
Directed Acyclic Graph (DAG) Model
Redrawn · diagram-design
Transcoding a video is computationally expensive and time-consuming.
DAG Model defines tasks like encoding, thumbnail generation, and watermarking.
Allows high parallelism in video processing.
The original video is split into video, audio, and metadata.
Video encodings: Videos are converted to support different resolutions, codec, bitrates.
Thumbnail: It can either be uploaded by a user or automatically generated bythe system.
Watermark: Image overlay on top of your video contains identifying information about the video.
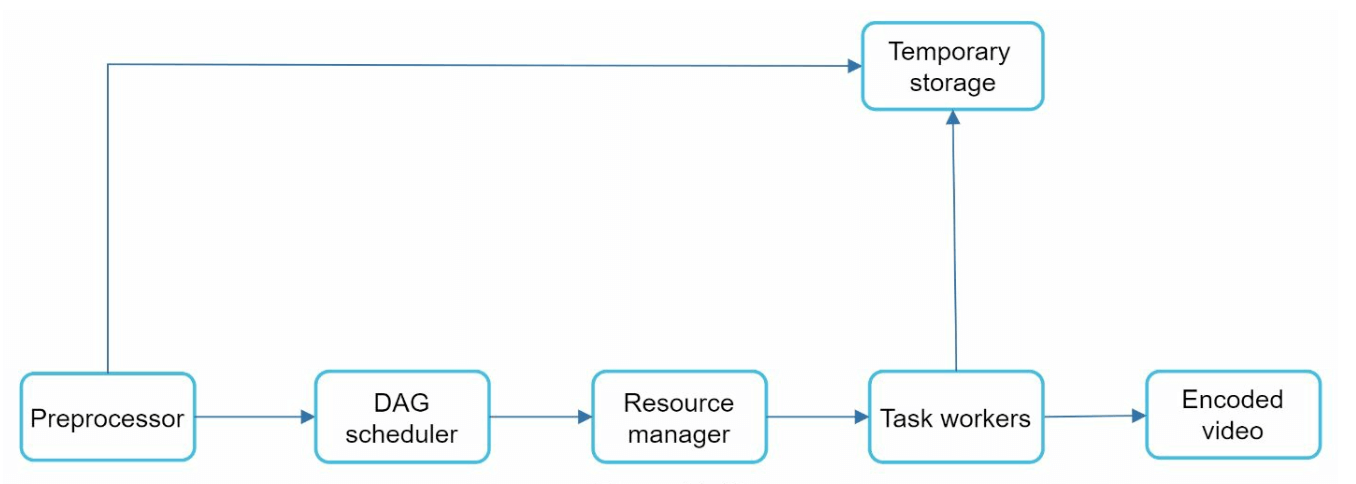
Video Transcoding Architecture
Redrawn · diagram-design
Preprocessor: Splits videos into smaller chunks (GOP alignment). It has 4 responsibilities.
Redrawn · diagram-design
Video splitting: Video stream is split or further split into smaller Group of Pictures (GOP) alignment.
It split videos by GOP alignment for old clients.
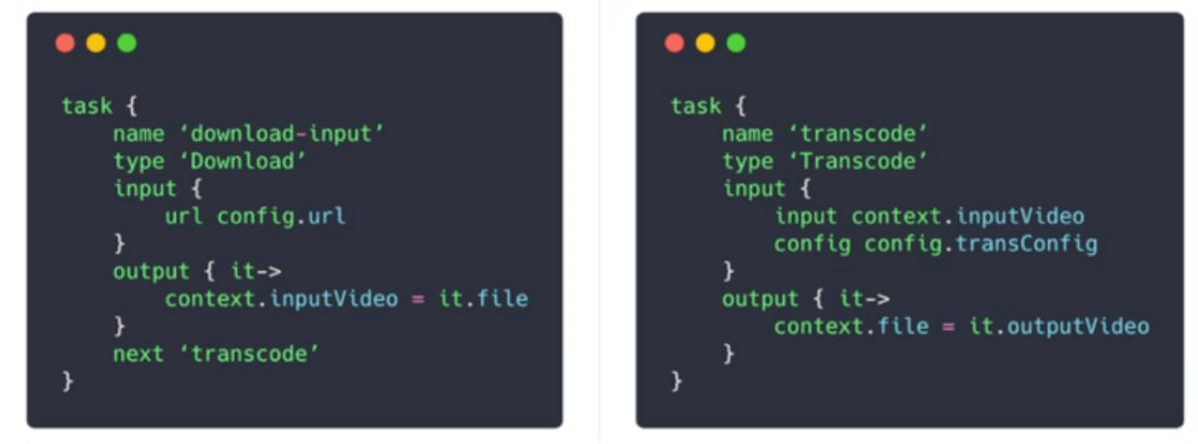
It generates DAG based on configuration files client programmers write.
It stores GOPs and metadata in temporary storage in case the encoding fails, the system could use persisted data for retry operations.
DAG Scheduler: Organizes tasks into sequential or parallel stages.
Redrawn · diagram-design
It splits a DAG graph into stages of tasks and puts them in the task queue in the resource manager.
Stage 1: video, audio, and metadata.
The video file is further split into two tasks in stage 2: video encoding and thumbnail.
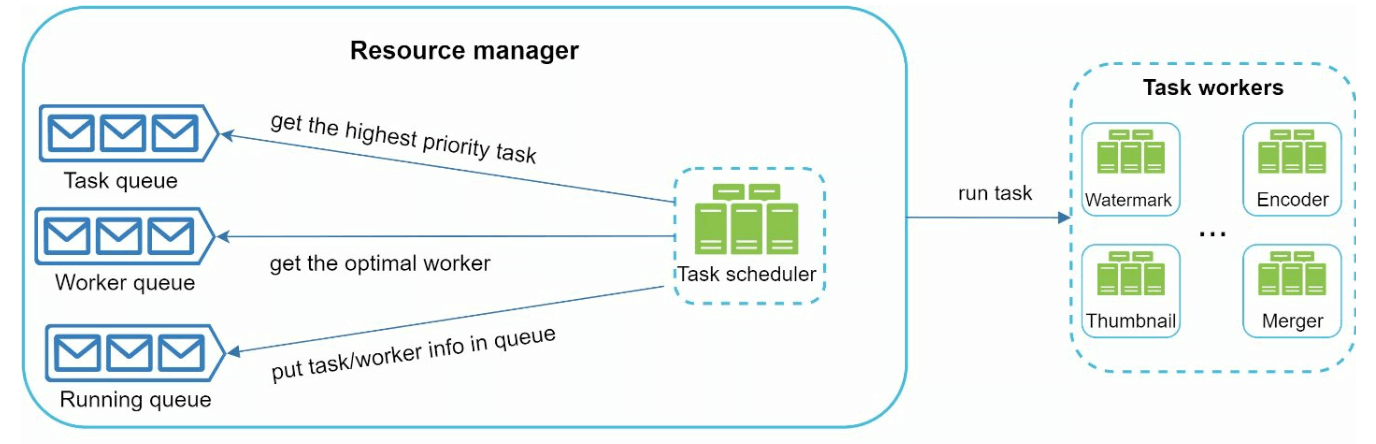
Resource Manager: Responsible for managing the efficiency of resource allocation.It
contains 3 queues and a task scheduler.
Redrawn · diagram-design
Task queue: priority queue that contains tasks to be executed.
Worker queue: priority queue that contains worker utilization info.
Running queue: contains currently running tasks and workers running the tasks.
Task scheduler: picks the optimal task/worker, and instructs the chosen task worker to execute the job.
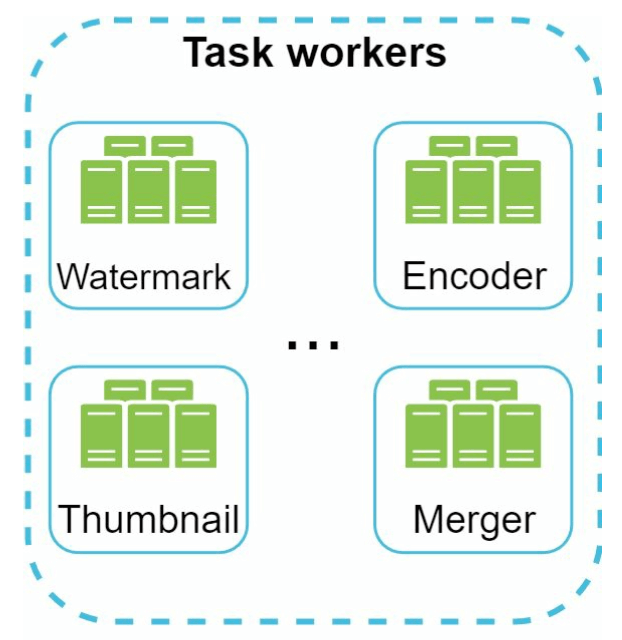
Task Workers: Perform transcoding and other operations.
Redrawn · diagram-design
Different task workers may run different tasks
Temporary Storage: Stores intermediate data for retries.
The choice of storage system depends on factors like data type, data size, access frequency, data life span, etc.
Output: Transcoded videos ready for distribution.
System Optimizations
Speed Optimizations
Parallel Video Uploads: Split videos into smaller chunks for faster, resumable uploads.
Redrawn · diagram-design
Distributed Upload Centers: Use CDNs as upload hubs close to users.
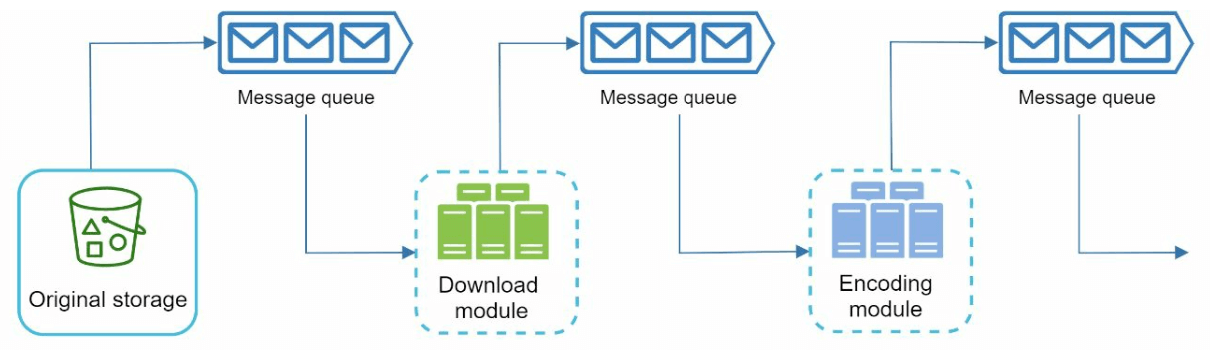
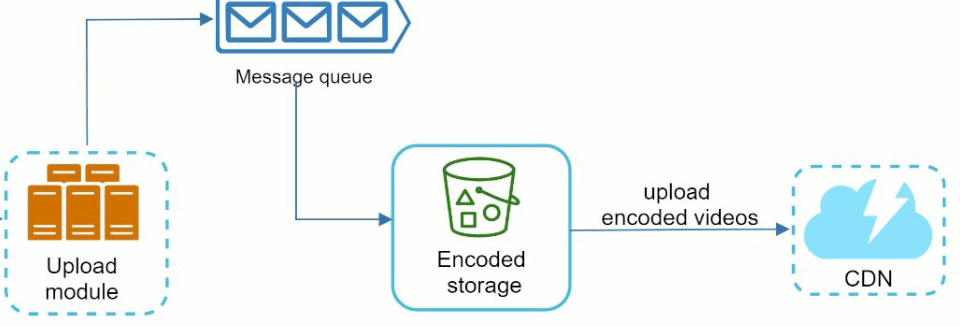
Parallel Processing: Decouple modules using message queues for high parallelism.
Redrawn · diagram-design
Redrawn · diagram-design
Safety Optimizations
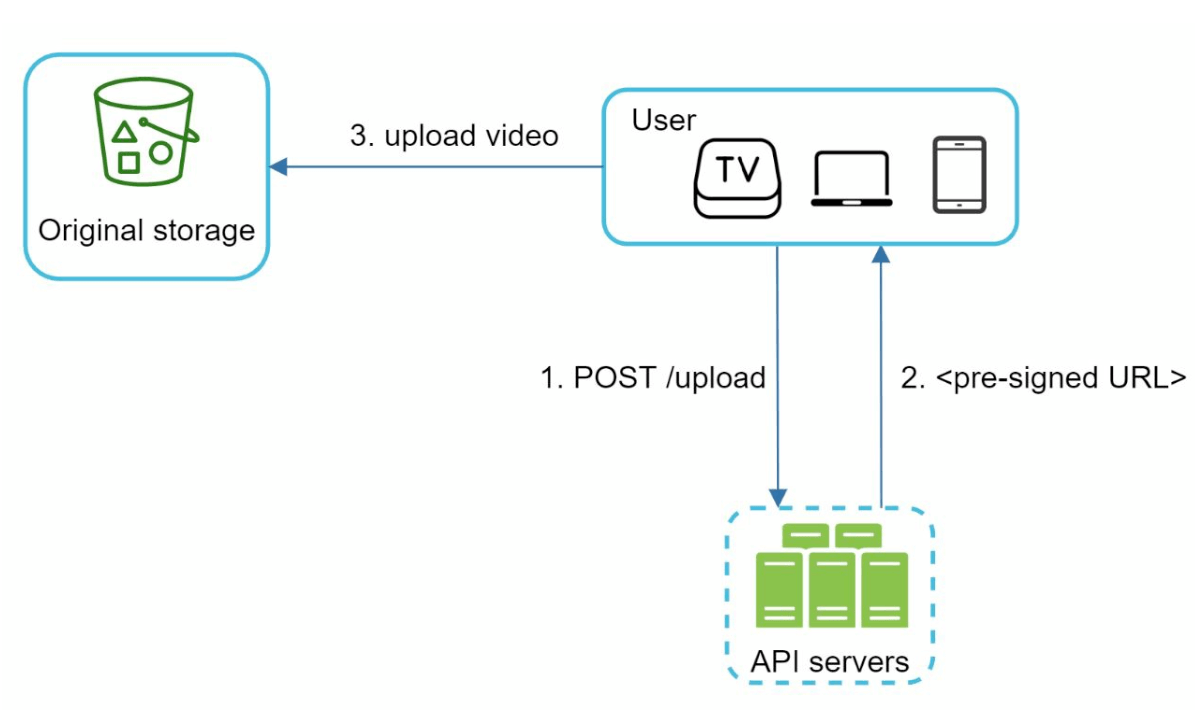
Pre-Signed URLs: Restrict video uploads to authorized users.
Redrawn · diagram-design
Protect Videos:
DRM Systems (e.g., Apple FairPlay, Google Widevine).
AES Encryption.
Watermarking.
Cost-Saving Optimizations
Serve only popular videos via CDN; less popular ones from high-capacity servers.
Encode on-demand for rarely accessed videos.
Regionalize video distribution based on popularity.
Build custom CDNs and partner with ISPs to reduce bandwidth costs.
Error Handling
Recoverable Errors
Retry failed uploads, transcoding, or resource allocation tasks.
Non-Recoverable Errors
Stop malformed video processing and return error codes.
Chapter 15: Design Google Drive
Introduction
Google Drive is a cloud-based file storage and synchronization service that allows users to store, access, and share files from various devices. This chapter discusses designing a scalable system with the following features:
File Upload and Download
File Sync Across Devices
File Sharing
File Revision History
Notifications for Edits, Deletes, and Shares
Step 1: Understanding the Problem
Key Requirements
Functional Requirements:
Upload and download files.
Sync files across multiple devices.
Maintain file revisions.
Enable file sharing with permissions.
Send notifications on file edits, deletions, and shares.
Non-Functional Requirements:
Reliability: Data loss is unacceptable.
Fast Sync Speed: Avoid user impatience with delayed syncing.
Bandwidth Efficiency: Minimize unnecessary data usage.
Scalability: Handle 10 million daily active users (DAU).
High Availability: Operate seamlessly during server failures or network issues.
Constraints and Assumptions
Users get 10 GB free space.
Maximum file size: 10 GB.
Average file upload size: 500 KB.
Upload frequency: 2 files per day per user.
Total storage required: 500 PB.
Step 2: High-Level Design
Single-Server Setup
A basic setup includes:
Web Server: Handles uploads and downloads.
Metadata Database: to keep track of metadata like user data, login info, files info/
Storage Directory: Holds files organized by namespaces.
Redrawn · diagram-design
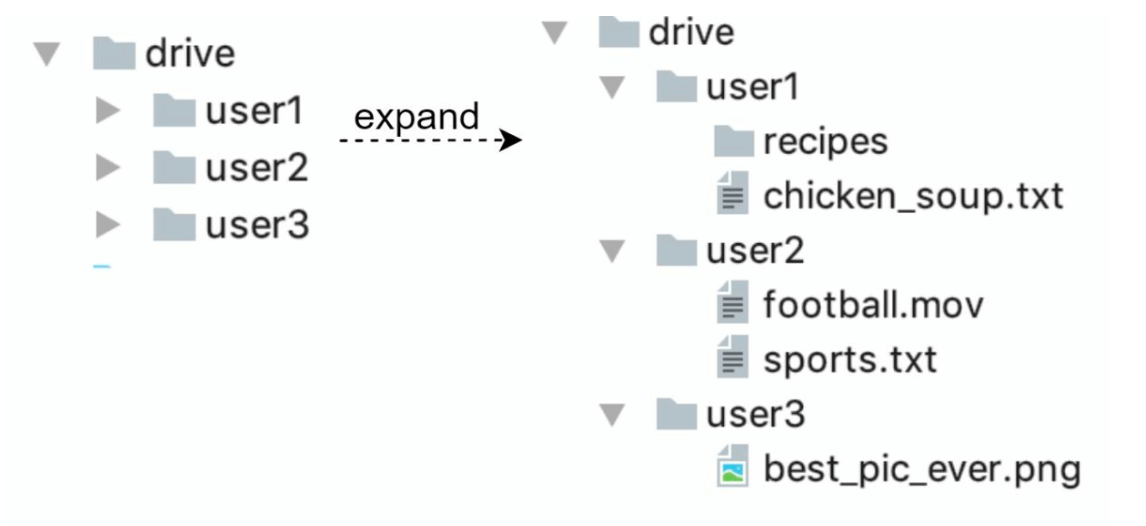
A web server and a directory called drive/ is set up as the root directory to store uploaded files.
Under drive/ directory, there is a list of directories called namespaces.
Each namespace contains all the uploaded files for that user.
Each file or folder can be uniquely identified by joining the namespace and the relative path.
This design serves as a starting point but is inadequate for scaling.
APIs
Upload a file to Google Drive: Two types of uploads are supported
Sharding: Split storage across servers based on user_id.
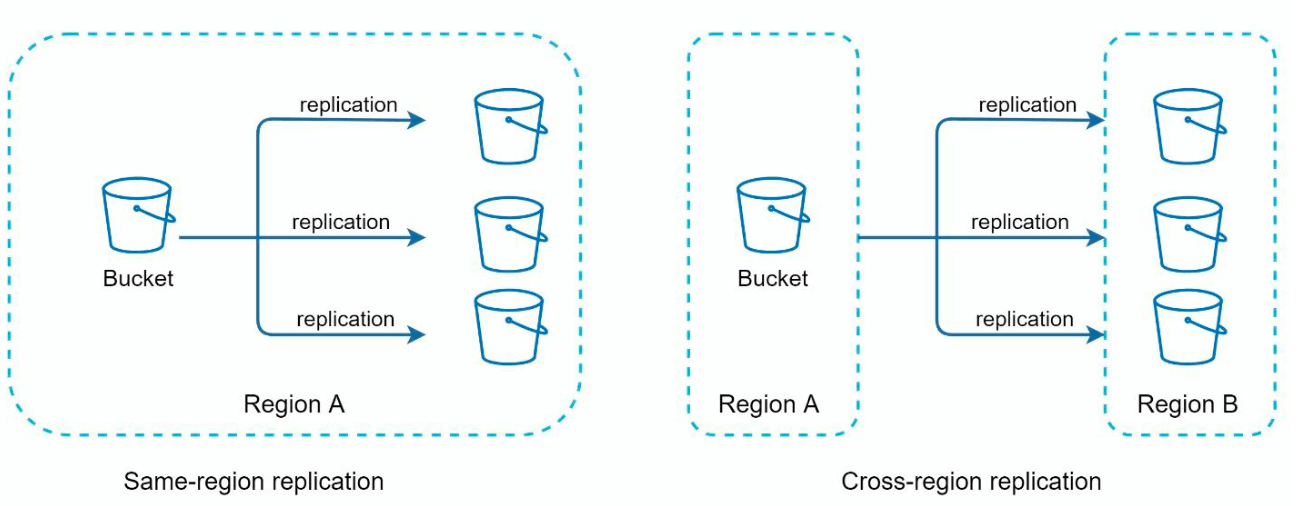
Amazon S3: Use S3 for scalable and redundant file storage with cross-region replication.
Redrawn · diagram-design
Load Balancer: Distribute traffic across multiple web servers.
Metadata Database Replication: Ensure availability through database sharding and replication.
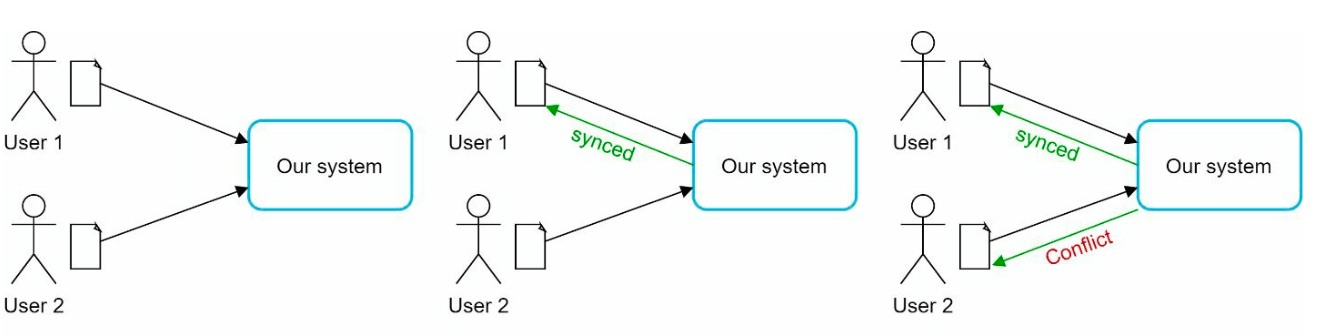
Sync Conflicts:
For a large storage system like Google Drive, sync conflicts happen from time to time.
When two users modify the same file or folder at the same time, a conflict happens.
Redrawn · diagram-design
In the example user 1 and user 2 tries to update the same file at the same time, but user 1’s file is processed by our system first.
User 1’s update operation goes through, but, user 2 gets a sync conflict.
The system presents both copies of the same file: user 2’s local copy and the latest version from the server.
User 2 has the option to merge both files or override one version with the other.
Improved design
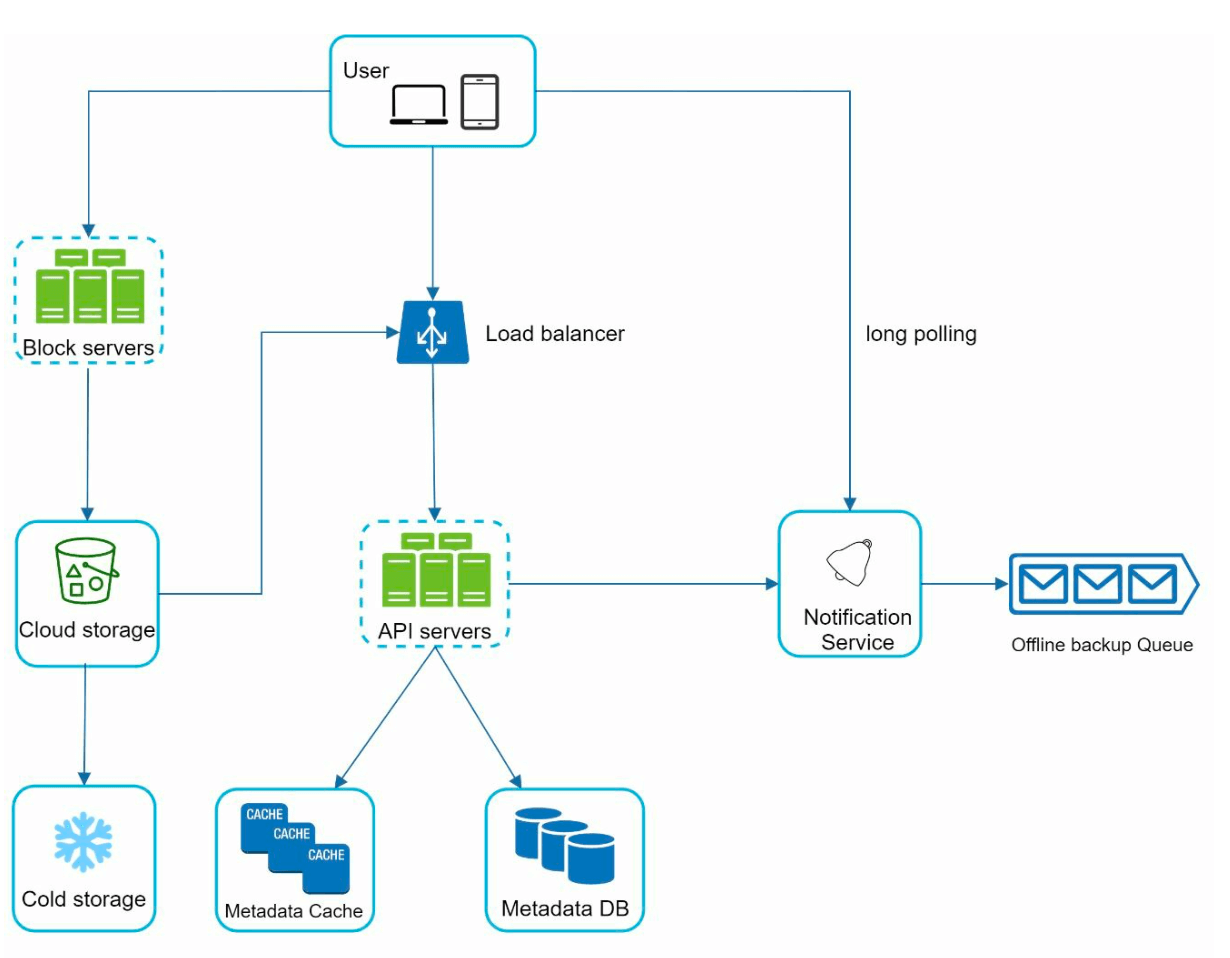
Redrawn · diagram-design
User Interaction:: Users access the application via browser or mobile app.
Block Servers:
Files are split into 4 MB blocks (maximum size) and assigned unique hash values.
Blocks are stored independently in cloud storage (e.g., Amazon S3).
File reconstruction involves joining blocks in a specific order.
Cloud Storage: Blocks are stored in cloud storage for scalability and redundancy.
Cold Storage: Inactive files are moved to cold storage to reduce costs.
Load Balancer: Distributes requests evenly among API servers to ensure efficient operation.
API Servers:
Handle user authentication, profile management, and file metadata updates.
Manage all non-uploading workflows.
Metadata Database and Cache:
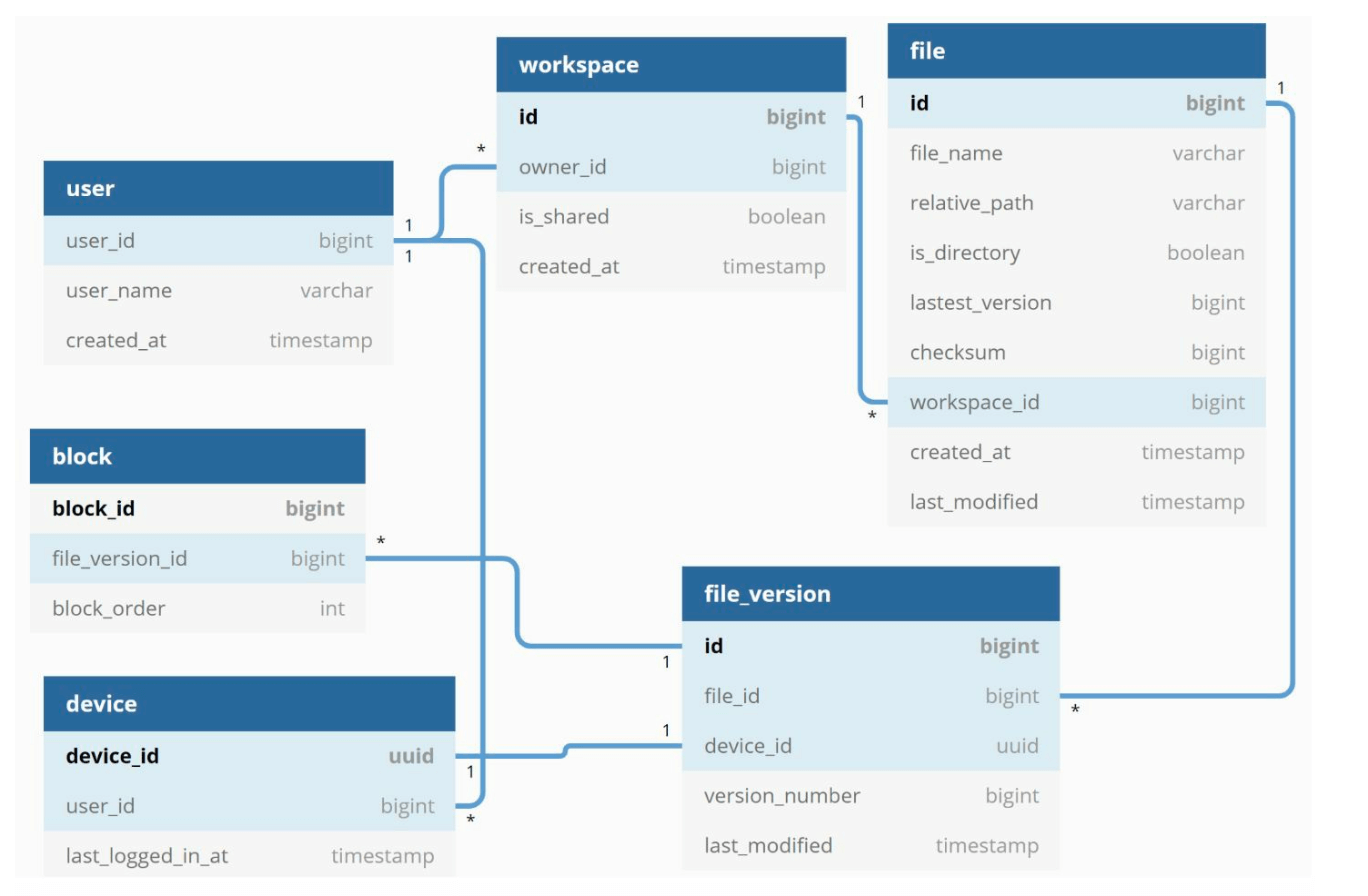
Stores metadata for users, files, blocks, and versions.
Frequently accessed metadata is cached for faster retrieval.
Notification Service:
A publisher/subscriber system that notifies clients about file changes (add, edit, delete).
Ensures clients can pull the latest updates.
Offline Backup Queue: Temporarily stores file change information for offline clients to sync when back online.
Step 3: Design Deep Dive
Metadata Database
A highly simplified is shown below version as it only includes the most important tables and fields.
Block Table: Tracks file blocks for reconstructing files.
File Version Table: Stores file revision history.
Redrawn · diagram-design
File Upload Flow
File Upload:
File is split into blocks, compressed, and encrypted by the block server.
Blocks are uploaded to block servers and stored in S3.
Metadata Upload:
Client sends metadata to the API server.
Metadata is stored in the database with status pending.
Completion:
S3 triggers a callback to update the file status to uploaded.
Notification service informs relevant users.
Redrawn · diagram-design
File Sync
Delta Sync: Transfer only modified blocks instead of the entire file.
Redrawn · diagram-design
Compression: Blocks are compressed using compression algorithms depending on file types.
Conflict Resolution:
First processed version wins.
Conflicting versions are saved separately for user resolution.
Redrawn · diagram-design
File Download Flow
Download flow is triggered when a file is added or edited elsewhere. There are two ways a client can know:
If client A is online while a file is changed by another client, notification service will inform client A.
If client A is offline while a file is changed by another client, data will be saved to the cache. When the offline client is online again, it pulls the latest changes.
Once a client knows a file is changed, it first requests metadata via API servers, then
downloads blocks to construct the file.
Trigger: Notification service informs the client of file updates.
Metadata Fetch: Client retrieves updated metadata via API.
Block Download: Client downloads updated blocks from block servers and reconstructs the file.
Redrawn · diagram-design
Notification Service
Purpose: Keeps clients updated about file changes.
Mechanism: Implements long polling for asynchronous notifications.
Example: When a file is added, edited, or deleted, notifications are pushed to all relevant clients.
Storage Optimization
De-duplication: Remove duplicate blocks at the account level using hash-based comparisons.
Versioning Strategy:
Limit the number of saved revisions.
Prioritize recent versions for frequently edited files.
Block Server Failure: Pending tasks are reassigned to other servers.
Metadata Database Failure:
Promote a slave node to master.
Redirect traffic to remaining replicas.
Cloud Storage Failure: Use cross-region replication to fetch unavailable files.
Notification Service Failure: Clients reconnect to alternative servers.
Chapter 16: Proximity Service
Introduction
A proximity service is designed to find nearby locations, such as restaurants, hotels, gas stations, and other businesses. This functionality is used in applications like Google Maps and Yelp to help users discover places within a defined radius.
Step 1: Understanding the Problem and Establishing Scope
Functional Requirements
Search for businesses based on user location (latitude, longitude) and search radius.
Allow business owners to add, update, or delete businesses (not real-time).
Provide detailed business information when requested.
Non-Functional Requirements
Low latency: Users should get quick responses.
Data privacy: Compliance with GDPR and CCPA regulations.
High availability: Handle peak-hour spikes in busy locations.
Back-of-the-Envelope Estimation
100 million daily active users.
200 million businesses in the system.
Search QPS Calculation:
Users make 5 searches per day.
Search QPS = (100M × 5) / 86,400 ≈ 5,000 QPS.
Step 2: High-Level Design
API Design
Search Nearby Businesses
GET /v1/search/nearby
Request Parameters:
latitude: User’s location latitude.
longitude: User’s location longitude.
radius: Search radius (default: 5000m).
Business APIs
API Endpoint
Description
GET /v1/businesses/{id}
Fetch detailed business info
POST /v1/businesses
Add a new business
PUT /v1/businesses/{id}
Update business details
DELETE /v1/businesses/{id}
Remove a business from the system
Data Model
Since the read volume is high because two features are very commonly used, a realtional database such as MySQL is a good fit.
Search for nearby businesses
View the detailed information of a business
Data Schema
Key Database tables are the business table and the geospatial index table
The business table consists the detailed information about a business.
High-Level System Architecture
The system comprises of two parts: Location based service (LBS) and business related service.
Redrawn · diagram-design
Location-Based Service (LBS):
Processes location-based search queries.
Read-heavy service with no write requests.
QPS is high especially during peak hours in dense areas and the system is stateless.
Business Service: Deals with two types of requests.
Business owners create, update or delete businesses.
Customers view detailed information about a business.
Load Balancer: Routes traffic to LBS and Business service.
Database Cluster:
Uses primary-replica architecture for read-heavy workloads.
There might be some discrepancy between data read b/w data read by LBS and data written by by primary database.
This incosistency is not an issue beacuase the business information is not updated in real-time.
Step 3: Algorithms for Fetching Nearby Businesses
Option 1: Two-Dimensional Search (Naive Approach)
Redrawn · diagram-design
The most intuitive way is to draw a circle with pre-defined radius and find all the businesses within the circle.
SQL Query:
SELECT business_id, latitude, longitude
FROM business
WHERE (latitude BETWEEN :lat - radius AND :lat + radius)
AND (longitude BETWEEN :long - radius AND :long + radius);
Problems:
Inefficient: Requires scanning the entire database.
Limited by one-dimensional indexes (latitude/longitude).
A potiential improvement is to build index on logitude and latitude columns, alhtough this is slighlty better but still vry slow.
Better Approach
The problem with last approach is that the database index can only increase search speed in one dimension.
An optimal apporach is to reprsent the two-dimensional data into one dimension using geospatial indexing.
Hash: Even grid, Geo Hash
Tree: Quadtree, Google S2, RTree
Redrawn · diagram-design
Option 2: Evenly Divided Grid
Redrawn · diagram-design
Divides the world into fixed-size grids.
Issue: Uneven business distribution (high density in cities, sparse in rural areas).
Option 3: Geohash
Divide the planet into four quadrants along with the prime meridian and equator. And then divide each grid into four smaller grids.
Each grids can be represented by altering b/w longitude and latitude bit.
Repeat this subdivision
Redrawn · diagram-design
Redrawn · diagram-design
Encodes latitude and longitude into a single alphanumeric string. It has 12 precisions (levels)
Hierarchical grid structure allows for efficient searching.
The right precision is chosen by using the minimal geohash length according to the table.
Redrawn · diagram-design
Geohash guarantees that the longer a shared prefix is between two geohashes, the closer they are.
Challenges:
Redrawn · diagram-design
Boundary issues (businesses close to grid edges may get excluded).
Two locations can be very close but have no shared prefix at all (can be on other side of equator)
Two locations can have a long shared prefix but belong to different geohashes.
Solution: Need to search neighboring grids.
Option 4: Quadtree
A quadtree is a tree data structure that recursively divides a two-dimensional space into four quadrants, with each internal node having exactly four children, representing the four sub-regions of the space.
The quadtree is an in-memory data structure and it runs on each LBS server and built on server startup time.
Redrawn · diagram-design
The root node is recursively broken down into 4 quadrants until no nodes are left with more than x number of businesses (100 in this case).
Redrawn · diagram-design
The quadtree index doen't take too much memory (typically in GBs) and can easily fit in one server.
Since tge time complexity to build the tree is nlogn, it might take a few minutes to build the tree.
Efficient for k-nearest search queries (e.g., find the closest gas station).
Redrawn · diagram-design
Operational considerations
For around 200 million businesses, it might take few minutes to build a quadtree at the server start time.
While the quadtree is built it cannot serve traffic, therefore a new release should be rolled out incrementally to a subset of servers.
When updating a business or adding a new the easiest approach is to incrementally rebuild the quadtree. (Leading to a lot of cache invalidation)
Also possible to update the quadtree on the fly but more complex to implement. (Needs locking mechanism)
Option 5: Google S2
It maps a sphere to a !D index based on Hilbert curve.Two points that are close to each other on the Hilbert curve are close in 1D space.
Redrawn · diagram-design
Redrawn · diagram-design
Divides the earth into small cells using a Hilbert curve.
Great for geofencing becuase it can cover arbitrary areas with varying levels.
Geofencing also allows to define parameters that surround the area of interest.
Aother advantage if instead of having a fixed level of precision, we can specify min,max level and max cells in S2.
Tradeoff Comparison
Geohash
Easy to use and implement- No need to build/rebuild a tree
Supports fixed radius results
Updating the index is easy.
Cannot dynamically adjust the grid size based on population density.
Quadtree
Slightly harder to implement.
Supports fetching k-nearest businesses.
Can dynamically adjust the grid size based on population desnsity.
Updating the index is more complicated as might need to rebuild the whole tree.
Step 4: Scaling the Database and Caching Strategy
Scaling the Business Table
Sharding by business ID ensures even data distribution.
We have separate rows for each business in the table.
Geohash
Business ID
9q9hvu
343
9q9hvu
347
9q9hvu
112
Scaling the Geospatial Index
Might not be a good fit for the geohash table. In this case everything can fit in a single server so there's no tehcnical reason for sharding.
A better approach is to have read-replicas to help with read loads.
Cache Strategy
The most obvious cache key choice is the location coordinate, however it has a few issues:
Location coordinates from gps are not accurate.
A user can move casuing the location coordinate to change.
A better key is the geohash.
Cache Key
Cache Value
geohash
List of business IDs in that grid
business_id
Business details (name, address, reviews, etc.)
Step 5: Deployment Strategy and Final Architecture
Region and Availability Zones
Deploy LBS and Business Service across multiple regions.
Handling Real-Time Updates
Business updates are batch processed daily.
Final System Architecture
Redrawn · diagram-design
This final algorithm looks like this:
Steps to Retrieve Nearby Businesses
User Request:
A user searches for restaurants within 500 meters.
The client sends latitude (37.776720), longitude (-122.416730), and radius (500m) to the load balancer.
Request Forwarding:
The load balancer (LB) forwards the request to the Location-Based Service (LBS).
Geohash Calculation:
LBS determines the geohash length matching the radius.
Using a reference table, 500m corresponds to geohash length = 6.
Fetching Neighboring Geohashes:
LBS calculates neighboring geohashes to include nearby areas.
This chapter focuses on designing a scalable backend for an application which enables user to share their location and discover friends who are nearby.
The major difference with the proximity chapter is that in this problem, locations constantly change, whereas in that one, business addresses more or less stay the same.
Step 1: Understand the Problem and Establish Design Scope
Some questions to drive the interview:
C: How geographically close is considered to be "nearby"?
I: 5 miles, this number should be configurable
C: Is distance calculated as straight-line distance vs. taking into consideration eg a river in-between friends
I: Yes, that is a reasonable assumption
C: How many users does the app have?
I: 1bil users and 10% of them use the nearby friends feature
C: Do we need to store location history?
I: Yes, it can be valuable for eg machine learning
C: Can we assume inactive friends will disappear from the feature in 10min
I: Yes
C: Do we need to worry about GDPR, etc?
I: No, for simlicity's sake
Functional requirements
Users should be able to see nearby friends on their mobile app. Each friend has a distance and timestamp, indicating when the location was updated
Nearby friends list should be updated every few seconds
Non-functional requirements
Low latency: it's important to receive location updates without too much delay
Reliability: Occassional data point loss is acceptable, but system should be generally available
Eventual consistency: Location data store doesn't need strong consistency. Few seconds delay in receiving location data in different replicas is acceptable
Back-of-the-envelope
Some estimations to determine potential scale:
Nearby friends are friends within 5mile radius
Location refresh interval is 30s. Human walking speed is slow, hence, no need to update location too frequently.
On average, 100mil users use the feature every day \w 10% concurrent users, ie 10mil
On average, a user has 400 friends, all of them use the nearby friends feature
App displays 20 nearby friends per page
Location Update QPS = 10mil / 30 == ~334k updates per second
Step 2: Propose High-Level Design and Get Buy-In
Before exploring API and data model design, we'll study the communication protocol we'll use as it's less ubiquitous than traditional request-response communication model.
High-level design
At a high-level we'd want to establish effective message passing between peers. This can be done via a peer-to-peer protocol, but that's not practical for a mobile app with flaky connection and tight power consumption constraints.
A more practical approach is to use a shared backend as a fan-out mechanism towards friends you want to reach:
Redrawn · diagram-design
What does the backend do?
Receives location updates from all active users
For each location update, find all active users which should receive it and forward it to them
Do not forward location data if distance between friends is beyond the configured threshold
This sounds simple but the challenge is to design the system for the scale we're operating with.
We'll start with a simpler design at first and discuss a more advanced approach in the deep dive:
Redrawn · diagram-design
Load balancer: spreads traffic across rest API servers as well as bidirectional web socket servers
Rest API servers: handles auxiliary tasks such as managing friends, updating profiles, etc
Websocket servers: stateful servers, which forward location update requests to respective clients. It also manages seeding the mobile client with nearby friends locations at initialization (discussed in detail later).
Redis location cache: used to store most recent location data for each active user. There is a TTL set on each entry in the cache. When the TTL expires, user is no longer active and their data is removed from the cache.
User database: stores user and friendship data. Either a relational or NoSQL database can be used for this purpose.
Location history database: stores a history of user location data, not necessarily used directly within nearby friends feature, but instead used to track historical data for analytical purposes
Redis pubsub: used as a lightweight message bus which enables different topics for each user channel for location updates.
Redrawn · diagram-design
In the above example, websocket servers subscribe to channels for the users which are connected to them & forward location updates whenever they receive them to appropriate users.
Periodic location update
Here's how the periodic location update flow works:
Redrawn · diagram-design
Mobile client sends a location update to the load balancer
Load balancer forwards location update to the websocket server's persistent connection for that client
Websocket server saves location data to location history database
Location data is updated in location cache. Websocket server also saves location data in-memory for subsequent distance calculations for that user
Websocket server publishes location data in user's channel via redis pub sub
Redis pubsub broadcasts location update to all subscribers for that user channel, ie servers responsible for the friends of that user
Subscribed web socket servers receive location update, calculate which users the update should be sent to and sends it
Here's a more detailed version of the same flow:
Redrawn · diagram-design
On average, there's going to be 40 location updates to forward as a user has 400 friends on average and 10% of them are online at a time.
API Design
Websocket Routines we'll need to support:
periodic location update - user sends location data to websocket server
client receives location update - server sends friend location data and timestamp
websocket client initialization - client sends user location, server sends back nearby friends location data
Subscribe to a new friend - websocket server sends a friend ID mobile client is supposed to track eg when friend appears online for the first time
Unsubscribe a friend - websocket server sends a friend ID, mobile client is supposed to unsubscribe from due to eg friend going offline
HTTP API - traditional request/response payloads for auxiliary responsibilities.
Data model
The location cache will store a mapping between user_id and lat,long,timestamp. Redis is a great choice for this cache as we only care about current location and it supports TTL eviction which we need for our use-case.
Location history table stores the same data but in a relational table \w the four columns stated above. Cassandra can be used for this data as it is optimized for write-heavy loads.
Step 3: Design Deep Dive
Let's discuss how we scale the high-level design so that it works at the scale we're targetting.
How well does each component scale?
API servers: can be easily scaled via autoscaling groups and replicating server instances
Websocket servers: we can easily scale out the ws servers, but we need to ensure we gracefully shutdown existing connections when tearing down a server. Eg we can mark a server as "draining" in the load balancer and stop sending connections to it, prior to being finally removed from the server pool
Client initialization: when a client first connects to a server, it fetches the user's friends, subscribes to their channels on redis pubsub, fetches their location from cache and finally forwards to client
User database: We can shard the database based on user_id. It might also make sense to expose user/friends data via a dedicated service and API, managed by a dedicated team
Location cache: We can shard the cache easily by spinning up several redis nodes. Also, the TTL puts a limit on the max memory we could have taken up at a time. But we still want to handle the large write load
Redis pub/sub server: we leverage the fact that no memory is consumed if there are channels initialized but are not in use. Hence, we can pre-allocate channels for all users who use the nearby friends feature to avoid having to deal with eg bringing up a new channel when a user comes online and notifying active websocket servers
Scaling deep-dive on redis pub/sub component
We will need around 200gb of memory to maintain all pub/sub channels. This can be achieved by using 2 redis servers with 100gb each.
Given that we need to push ~14mil location updates per second, we will however need at least 140 redis servers to handle that amount of load, assuming that a single server can handle ~100k pushes per second.
Hence, we'll need a distributed redis server cluster to handle the intense CPU load.
In order to support a distributed redis cluster, we'll need to utilize a service discovery component, such as zookeeper or etcd, to keep track of which servers are alive.
What we need to encode in the service discovery component is this data:
Redrawn · diagram-design
Web socket servers use that encoded data, fetched from zookeeper to determine where a particular channel lives. For efficiency, the hash ring data can be cached in-memory on each websocket server.
In terms of scaling the server cluster up or down, we can setup a daily job to scale the cluster as needed based on historical traffic data. We can also overprovision the cluster to handle spikes in loads.
The redis cluster can be treated as a stateful storage server as there is some state maintained for the channels and there is a need for coordination with subscribers so that they hand-off to newly provisioned nodes in the cluster.
We have to be mindful of some potential issues during scaling operations:
There will be a lot of resubscription requests from the web socket servers due to channels being moved around
Some location updates might be missed from clients during the operation, which is acceptable for this problem, but we should still minimize it from happening. Consider doing such operation when traffic is at lowest point of the day.
We can leverage consistent hashing to minimize amount of channels moved in the event of adding/removing servers
Redrawn · diagram-design
Adding/removing friends
Whenever a friend is added/removed, websocket server responsible for affected user needs to subscribe/unsubscribe from the friend's channel.
Since the "nearby friends" feature is part of a larger app, we can assume that a callback on the mobile client side can be registered whenever any of the events occur and the client will send a message to the websocket server to do the appropriate action.
Users with many friends
We can put a cap on the total number of friends one can have, eg facebook has a cap of 5000 max friends.
The websocket server handling the "whale" user might have a higher load on its end, but as long as we have enough web socket servers, we should be okay.
Nearby random person
What if the interviewer wants to update the design to include a feature where we can occasionally see a random person pop up on our nearby friends map?
One way to handle this is to define a pool of pubsub channels, based on geohash:
Redrawn · diagram-design
Anyone within the geohash subscribes to the appropriate channel to receive location updates for random users:
Redrawn · diagram-design
We could also subscribe to several geohashes to handle cases where someone is close but in a bordering geohash:
Redrawn · diagram-design
Alternative to Redis pub/sub
An alternative to using Redis for pub/sub is to leverage Erlang - a general programming language, optimized for distributed computing applications.
With it, we can spawn millions of small, erland processes which communicate with each other. We can handle both websocket connections and pub/sub channels within the distributed erlang application.
A challenge with using Erlang, though, is that it's a niche programming language and it could be hard to source strong erlang developers.
Step 4: Wrap Up
We successfully designed a system, supporting the nearby friends features.
Core components:
Web socket servers: real-time comms between client and server
Redis: fast read and write of location data + pub/sub channels
We also explored how to scale restful api servers, websocket servers, data layer, redis pub/sub servers and we also explored an alternative to using Redis Pub/Sub. We also explored a "random nearby person" feature.
Chapter 18: Google Maps
Introduction
We'll design a simple version of Google Maps.
Some facts about google maps:
Started in 2005
Provides various services - satellite imagery, street maps, real-time traffic conditions, route planning
By 2021, had 1bil daily active users, 99% coverage of the world, 25mil updates daily of real-time location info
Step 1: Understand the Problem and Establish Design Scope
Sample Q&A between candidate and interviewer:
C: How many daily active users are we dealing with?
I: 1bil DAU
C: What features should we focus on?
I: Location update, navigation, ETA, map rendering
C: How large is road data? Do we have access to it?
I: We obtained road data from various sources, it's TBs of raw data
C: Should we take traffic conditions into consideration?
I: Yes, we should for accurate time estimations
C: How about different travel modes - by foot, biking, driving?
I: We should support those
C: How about multi-stop directions?
I: Let's not focus on that for scope of interview
C: Business places and photos?
I: Good question, but no need to consider those
We'll focus on three key features - user location update, navigation service including ETA, map rendering.
Non-functional requirements
Accuracy: user shouldn't get wrong directions
Smooth navigation: Users should experience smooth map rendering
Data and battery usage: Client should use as little data and battery as possible. Important for mobile devices.
General availability and scalability requirements
Map 101
Before jumping into the design, there are some map-related concepts we should understand.
Positioning system
World is a sphere, rotating on its axis. Positiions are defined by latitude (how far north/south you are) and longitude (how far east/west you are):
Redrawn · diagram-design
Going from 3D to 2D
The process of translating points from 3D to 2D plane is called "map projection".
There are different ways to do it and each comes with its pros and cons. Almost all distort the actual geometry.
Redrawn · diagram-design
Google maps selected a modified version of Mercator projection called "Web Mercator".
Geocoding
Geocoding is the process of converting addresses to geographic coordinates.
The reverse process is called "reverse geocoding".
One way to achieve this is to use interpolation - leveraging data from different sources (eg GIS-es) where street network is mapped to geo coordinate space.
Geohashing
Geohashing is an encoding system which encodes a geographic area into a string of letters and digits.
It depicts the world as a flattened surface and recursively sub-divides it into four quadrants:
Redrawn · diagram-design
Map rendering
Map rendering happens via tiling. Instead of rendering entire map as one big custom image, world is broken up into smaller tiles.
Client only downloads relevant tiles and renders them like stitching together a mosaic.
There are different tiles for different zoom levels. Client chooses appropriate tiles based on the client's zoom level.
Eg, zooming out the entire world would download only a single 256x256 tile, representing the whole world.
Road data processing for navigation algorithms
In most routing algorithms, intersections are represented as nodes and roads are represented as edges:
Redrawn · diagram-design
Most navigation algorithms use a modified version of Djikstra or A* algorithms.
Pathfinding performance is sensitive to the size of the graph. To work at scale, we can't represent the whole world as a graph and run the algorithm on it.
Instead, we use a technique similar to tiling - we subdivide the world into smaller and smaller graphs.
Routing tiles hold references to neighboring tiles and algorithms can stitch together a bigger road graph as it traverses interconnected tiles:
Redrawn · diagram-design
This technique enables us to significantly reduce memory bandwidth and only load the tiles we need for the given source/destination pair.
However, for larger routes, stitching together small, detailed routing tiles would still be time/memory consuming. Instead, there are routing tiles with different level of detail and the algorithm uses the appropriately-detailed tiles, based on the destination we're headed for:
Redrawn · diagram-design
Back-of-the-envelope estimation
For storage, we need to store:
map of the world - estimated as ~70pb based on all the tiles we need to store, but factoring in compression of very similar tiles (eg vast desert)
metadata - negligible in size, so we can skip it from calculation
Road info - stored as routing tiles
Estimated QPS for navigation requests - 1bil DAU at 35min of usage per week -> 5bil minutes per day.
Assuming gps update requests are batched, we arrive at 200k QPS and 1mil QPS at peak load
Step 2: Propose High-Level Design and Get Buy-In
Redrawn · diagram-design
Location service
Redrawn · diagram-design
It is responsible for recording a user's location updates:
location updates are sent every t seconds
location data streams can be used to improve the service over time, eg provide more accurate ETAs, monitor traffic data, detect closed roads, analyze user behavior, etc
Instead of sending location updates to the server all the time, we can batch the updates on the client-side and send batches instead:
Redrawn · diagram-design
Despite this optimization, for a system of Google Maps scale, load will still be significant. Therefore, we can leverage a database, optimized for heavy writes such as Cassandra.
We can also leverage Kafka for efficient stream processing of location updates, meant for further analysis.
Example location update request payload:
POST /v1/locations
Parameters
  locs: JSON encoded array of (latitude, longitude, timestamp) tuples.
Navigation service
This component is responsible for finding fast routes between A and B in a reasonable time (a little bit of latency is okay). Route need not be the fastest, but accuracy is important.
Example request payload:
GET /v1/nav?origin=1355+market+street,SF&destination=Disneyland
Traffic changes and reroutes are not taken into consideration yet, those will be tackled in the deep dive section.
Map rendering
Holding the entire data set of mapping tiles on the client-side is not feasible as it's petabytes in size.
They need to be fetched on-demand from the server, based on the client's location and zoom level.
When should new tiles be fetched - while user is zooming in/out and during navigation, while they're going towards a new tile.
How should the map tiles be served to the client?
They can be built dynamically, but that puts a huge load on the server and also makes caching hard
Map tiles are served statically, based on their geohash, which a client can calculate. They can be statically stored & served from a CDN
Redrawn · diagram-design
CDNs enable users to fetch map tiles from point-of-presence servers (POP) which are closest to users in order to minimize latency:
Redrawn · diagram-design
Options to consider for determining map tiles:
geohash for map tile can be calculated on the client-side. If that's the case, we should be careful that we commit to this type of map tile calculation for the long-term as forcing clients to update is hard
alternatively, we can have simple API which calculates the map tile URLs on behalf of the clients at the cost of additional API call
Redrawn · diagram-design
Step 3: Design Deep Dive
Data model
Let's discuss how we store the different types of data we're dealing with.
Routing tiles
Initial road data set is obtained from different sources. It is improved over time based on location updates data.
The road data is unstructured. We have a periodic offline processing pipeline, which transforms this raw data into the graph-based routing tiles our app needs.
Instead of storing these tiles in a database as we don't need any database features. We can store them in S3 object storage, while caching them agressively.
We can also leverage libraries to compress adjacency lists into binary files efficiently.
User location data
User location data is very useful for updaring traffic conditions and doing all sorts of other analysis.
We can use Cassandra for storing this kind of data as its nature is to be write-heavy.
Example row:
Redrawn · diagram-design
Geocoding database
This database stores a key-value pair of lat/long pairs and places.
We can use Redis for its fast read access speed, as we have frequent read and infrequent writes.
Precomputed images of the world map
As we discussed, we will precompute map tiling images and store them in CDN.
Redrawn · diagram-design
Services
Location service
Let's focus on the database design and how user location is stored in detail for this service.
Redrawn · diagram-design
We can use a NoSQL database to facilitate the heavy write load we have on location updates. We prioritize availability over consistency as user location data often changes and becomes stale as new updates arrive.
We'll choose Cassandra as our database choice as it nicely fits all our requirements.
Example row we're going to store:
Redrawn · diagram-design
user_id is the partition key in order to quickly access all location updates for a particular user
timestamp is the clustering key in order to store the data sorted by the time a location update is received
We also leverage Kafka to stream location updates to various other service which need the location updates for various purposes:
Redrawn · diagram-design
Rendering map
Map tiles are stored at various zoom levels. At the lowest zoom level, the entire world is represented by a single 256x256 tile.
As zoom levels increase, the number of map tiles quadruples:
Redrawn · diagram-design
One optimization we can use is to not send the entire image information over the network, but instead represent tiles as vectors (paths & polygons) and let the client render the tiles dynamically.
This will have substantial bandwidth savings.
Navigation service
This service is responsible for finding the fastest routes:
Redrawn · diagram-design
Let's go through each component in this sub-system.
First, we have the geocoding service which resolves an address to a location of lat/long pair.
The route planner service computes a suggested route, optimized for travel time according to current traffic conditions.
The shortest-path service runs a variation of the A* algorithm against the routing tiles in object storage to compute an optimal path:
It receives the source/destination pairs, converts them to lat/long pairs and derives the geohashes from those pairs to derive the routing tiles
The algorithm starts from the initial routing tile and starts traversing it until a good enough path is found to the destination tile
Redrawn · diagram-design
The ETA service is called by the route planner to get estimated time based on machine learning algorithms, predicting ETA based on traffic data.
The ranker service is responsible to rank different possible paths based on filters, passed by the user, ie flags to avoid toll roads or freeways.
The updater service asynchronously update some of the important databases to keep them up-to-date.
Improvement - adaptive ETA and rerouting
One improvement we can do is to adaptively update in-flight routes based on newly available traffic data.
One way to implement this is to store users who are currently navigating through a route in the database by storing all the tiles they're supposed to go through.
If a traffic accident happens on some tile, we can identify all users whose path goes through that tile and re-route them.
To reduce the amount of tiles we store in the database, we can instead store the origin routing tile and several routing tiles in different resolution levels until the destination tile is also included:
user_1, r_1, super(r_1), super(super(r_1)), ...
Redrawn · diagram-design
Using this, we only need to check if the final tile of a user includes the traffic accident tile to see if user is impacted.
We can also keep track of all possible routes for a navigating user and notify them if a faster re-route is available.
Delivery protocols
We have several options, which enable us to proactively push data to clients from the server:
Mobile push notifications don't work because payload is limited and it's not available for web apps
WebSocket is generally a better option than long-polling as it has less compute footprint on servers
We can also use server-sent events (SSE) but lean towards web sockets as they support bi-directional communication which can come in handy for eg a last-mile delivery feature
Step 4: Wrap Up
This is our final design:
Redrawn · diagram-design
One additional feature we could provide is multi-stop navigation which can be sold to enterprise customers such as Uber or Lyft in order to determine optimal path for visiting a set of locations.
Chapter 19: Distributed Message Queue
Introduction
We'll be designing a distributed message queue in this chapter.
Benefits of message queues:
Decoupling: Eliminates tight coupling between components. Let them update separately.
Improved scalability: Producers and consumers can be scaled independently based on traffic.
Increased availability: If one part of the system goes down, other parts continue interacting with the queue.
Better performance: Producers can produce messages without waiting for consumer confirmation.
Some popular message queue implementations - Kafka, RabbitMQ, RocketMQ, Apache Pulsar, ActiveMQ, ZeroMQ.
Strictly speaking, Kafka and Pulsar are not message queues. They are event streaming platforms.
There is however a convergence of features which blurs the distinction between message queues and event streaming platforms.
In this chapter, we'll be building a message queue with support for more advanced features such as long data retention, repeated message consumption, etc.
Step 1: Understand the Problem and Establish Design Scope
Message queues ought to support few basic features - producers produce messages and consumers consume them.
There are, however, different considerations with regards to performance, message delivery, data retention, etc.
Here's a set of potential questions between Candidate and Interviewer:
C: What's the format and average message size? Is it text only?
I: Messages are text-only and usually a few KBs
C: Can messages be repeatedly consumed?
I: Yes, messages can be repeatedly consumed by different consumers. This is an added requirement, which traditional message queues don't support.
C: Are messages consumed in the same order they were produced?
I: Yes, order guarantee should be preserved. This is an added requirement, traditional message queues don't support this.
C: What are the data retention requirements?
I: Messages need to have a retention of two weeks. This is an added requirement.
C: How many producers and consumers do we want to support?
I: The more, the better.
C: What data delivery semantic do we want to support? At-most-once, at-least-once, exactly-once?
I: We definitely want to support at-least-once. Ideally, we can support all and make them configurable.
C: What's the target throughput for end-to-end latency?
I: It should support high throughput for use cases like log aggregation and low throughput for more traditional use cases.
Functional requirements
Producers send messages to a message queue
Consumers consume messages from the queue
Messages can be consumed once or repeatedly
Historical data can be truncated
Message size is in the KB range
Order of messages needs to be preserved
Data delivery semantics is configurable - at-most-once/at-least-once/exactly-once.
Non-functional requirements
High throughput or low latency: Configurable based on use-case
Scalable: system should be distributed and support a sudden surge in message volume
Persistent and durable: data should be persisted on disk and replicated among nodes
Traditional message queues typically don't support data retention and don't provide ordering guarantees. This greatly simplifies the design and we'll discuss it.
Step 2: Propose High-Level Design and Get Buy-In
Key components of a message queue:
Redrawn · diagram-design
Producer sends messages to a queue
Consumer subscribes to a queue and consumes the subscribed messages
Message queue is a service in the middle which decouples producers from consumers, letting them scale independently.
Producer and consumer are both clients, while the message queue is the server.
Messaging models
The first type of messaging model is point-to-point and it's commonly found in traditional message queues:
Redrawn · diagram-design
A message is sent to a queue and it's consumed by exactly one consumer.
There can be multiple consumers, but a message is consumed only once.
Once message is acknowledged as consumed, it is removed from the queue.
There is no data retention in the point-to-point model, but there is such in our design.
On the other hand, the publish-subscribe model is more common for event streaming platforms:
Redrawn · diagram-design
In this model, messages are associated to a topic.
Consumers are subscribed to a topic and they receive all messages sent to this topic.
Topics, partitions and brokers
What if the data volume for a topic is too large? One way to scale is by splitting a topic into partitions (aka sharding):
Redrawn · diagram-design
Messages sent to a topic are evenly distributed across partitions
The servers that host partitions are called brokers
Each topic operates like a queue using FIFO for message processing. Message order is preserved within a partition.
The position of a message within the partition is called an offset.
Each message produced is sent to a specific partition. A partition key specifies which partition a message should land in.
Eg a user_id can be used as a partition key to guarantee order of messages for the same user.
Each consumer subscribes to one or more partitions. When there are multiple consumers for the same messages, they form a consumer group.
Consumer groups
Consumer groups are a set of consumers working together to consume messages from a topic:
Redrawn · diagram-design
Messages are replicated per consumer group (not per consumer).
Each consumer group maintains its own offset.
Reading messages in parallel by a consumer group improves throughput but hampers the ordering guarantee.
This can be mitigated by only allowing one consumer from a group to be subscribed to a partition.
This means that we can't have more consumers in a group than there are partitions.
High-level architecture
Redrawn · diagram-design
Clients: producer and consumer. Producer pushes messages to a designated topic. Consumer group subscribes to messages from a topic.
Brokers: hold multiple partitions. A partition holds a subset of messages for a topic.
Data storage: stores messages in partitions.
State storage: keeps the consumer states.
Metadata storage: stores configuration and topic properties
Coordination service: responsible for service discovery (which brokers are alive) and leader election (which broker is leader, responsible for assigning partitions).
Step 3: Design Deep Dive
In order to achieve high throughput and preserve the high data retention requirement, we made some important design choices:
We chose an on-disk data structure which takes advantage of the properties of modern HDD and disk caching strategies of modern OS-es.
The message data structure is immutable to avoid extra copying, which we want to avoid in a high volume/high traffic system.
We designed our writes around batching as small I/O is an enemy of high throughput.
Data storage
In order to find the best data store for messages, we must examine a message's properties:
Write-heavy, read-heavy
No update/delete operations. In traditional message queues, there is a "delete" operation as messages are not retained.
Database: not ideal as typical databases don't support well both write and read heavy systems.
Write-ahead log (WAL): a plain text file which only supports appending to it and is very HDD-friendly.
We split partitions into segments to avoid maintaining a very large file.
Old segments are read-only. Writes are accepted by latest segment only.
Redrawn · diagram-design
WAL files are extremely efficient when used with traditional HDDs.
There is a misconception that HDD acces is slow, but that hugely depends on the access pattern.
When the access pattern is sequential (as in our case), HDDs can achieve several MB/s write/read speed which is sufficient for our needs.
We also piggyback on the fact that the OS caches disk data in memory aggressively.
Message data structure
It is important that the message schema is compliant between producer, queue and consumer to avoid extra copying. This allows much more efficient processing.
Example message structure:
Redrawn · diagram-design
The key of the message specifies which partition a message belongs to. An example mapping is hash(key) % numPartitions.
For more flexibility, the producer can override default keys in order to control which partitions messages are distributed to.
The message value is the payload of a message. It can be plaintext or a compressed binary block.
Note: Message keys, unlike traditional KV stores, need not be unique. It is acceptable to have duplicate keys and for it to even be missing.
Other message files:
Topic: topic the message belongs to
Partition: The ID of the partition a message belongs to
Offset: The position of the message in a partition. A message can be located via topic, partition, offset.
Timestamp: When the message is stored
Size: the size of this message
CRC: checksum to ensure message integrity
Additional features such as filtering can be supported by adding additional fields.
Batching
Batching is critical for the performance of our system. We apply it in the producer, consumer and message queue.
It is critical because:
It allows the operating system to group messages together, amortizing the cost of expensive network round trips
Messages are written to the WAL in groups sequentially, which leads to a lot of sequential writes and disk caching.
There is a trade-off between latency and throughput:
High batching leads to high throughput and higher latency.
Less batching leads to lower throughput and lower latency.
If we need to support lower latency since the system is deployed as a traditional message queue, the system could be tuned to use a smaller batch size.
If tuned for throughput, we might need more partitions per topic to compensate for the slower sequential disk write throughput.
Producer flow
If a producer wants to send a message to a partition, which broker should it connect to?
One option is to introduce a routing layer, which route messages to the correct broker. If replication is enabled, the correct broker is the leader replica:
Redrawn · diagram-design
Routing layer reads the replication plan from the metadata store and caches it locally.
Producer sends a message to the routing layer.
Message is forwarded to broker 1 who is the leader of the given partition
Follower replicas pull the new message from the leader. Once enough confirmations are received, the leader commits the data and responds to the producer.
The reason for having replicas is to enable fault tolerance.
This approach works but has some drawbacks:
Additional network hops due to the extra component
The design doesn't enable batching messages
To mitigate these issues, we can embed the routing layer into the producer:
Redrawn · diagram-design
Fewer network hops lead to lower latency
Producers can control which partition a message is routed to
The buffer allows us to batch messages in-memory and send out larger batches in a single request, which increases throughput.
The batch size choice is a classical trade-off between throughput and latency.
Redrawn · diagram-design
Larger batch size leads to longer wait time before batch is committed.
Smaller batch size leads to request being sent sooner and having lower latency but lower throughput.
Consumer flow
The consumer specifies its offset in a partition and receives a chunk of messages, beginning from that offset:
Redrawn · diagram-design
One important consideration when designing the consumer is whether to use a push or a pull model:
Push model: leads to lower latency as broker pushes messages to consumer as it receives them.
However, if rate of consumption falls behind the rate of production, the consumer can be overwhelmed.
It is challenging to deal with consumers with varying processing power as the broker controls the rate of consumption.
Pull model: leads to the consumer controlling the consumption rate.
If rate of consumption is slow, consumer will not be overwhelmed and we can scale it to catch up.
The pull model is more suitable for batch processing, because with the push model, the broker can't know how many messages a consumer can handle.
With the pull model, on the other hand, consumers can aggressively fetch large message batches.
The down side is the higher latency and extra network calls when there are no new messages. Latter issue can be mitigated using long polling.
Hence, most message queues (and us) choose the pull model.
Redrawn · diagram-design
A new consumer subscribes to topic A and joins group 1.
The correct broker node is found by hashing the group name. This way, all consumers in a group connect to the same broker.
Note that this consumer group coordinator is different from the coordination service (ZooKeeper).
Coordinator confirms that the consumer has joined the group and assigns partition 2 to that consumer.
There are different partition assignment strategies - round-robin, range, etc.
Consumer fetches latest messages from the last offset. The state storage keeps the consumer offsets.
Consumer processes messages and commits the offset to the broker. The order of those operations affects the message delivery semantics.
Consumer rebalancing
Consumer rebalancing is responsible for deciding which consumers are responsible for which partition.
This process occurs when a consumer joins/leaves or a partition is added/removed.
The broker, acting as a coordinator plays a huge role in orchestrating the rebalancing workflow.
Redrawn · diagram-design
All consumers from the same group are connected to the same coordinator. The coordinator is found by hashing the group name.
When the consumer list changes, the coordinator chooses a new leader of the group.
The leader of the group calculates a new partition dispatch plan and reports it back to the coordinator, which broadcasts it to the other consumers.
When the coordinator stops receiving heartbeats from the consumers in a group, a rebalancing is triggered:
Redrawn · diagram-design
Let's explore what happens when a consumer joins a group:
Redrawn · diagram-design
Initially, only consumer A is in the group and it consumes all partitions.
Consumer B sends a request to join the group.
The coordinator notifies all group members that it's time to rebalance passively - as a response to the heartbeat.
Once all consumers rejoin the group, the coordinator chooses a leader and notifies the rest about the election result.
The leader generates the partition dispatch plan and sends it to the coordinator. Others wait for the dispatch plan.
Consumers start consuming from the newly assigned partitions.
Here's what happens when a consumer leaves the group:
Redrawn · diagram-design
Consumer A and B are in the same group
Consumer B asks to leave the group
When coordinator receives A's heartbeat, it informs them that it's time to rebalance.
The rest of the steps are the same.
The process is similar when a consumer doesn't send a heartbeat for a long time:
Redrawn · diagram-design
State storage
The state storage stores mapping between partitions and consumers, as well as the last consumed offsets for a partition.
Redrawn · diagram-design
Group 1's offset is at 6, meaning all previous messages are consumed. If a consumer crashes, the new consumer will continue from that message on wards.
Data access patterns for consumer states:
Frequent read/write operations, but low volume
Data is updated frequently, but rarely deleted
Random read/write
Data consistency is important
Given these requirements, a fast KV storage like Zookeeper is ideal.
Metadata storage
The metadata storage stores configuration and topic properties - partition number, retention period, replica distribution.
Metadata doesn't change often and volume is small, but there is a high consistency requirement.
Zookeeper is a good choice for this storage.
ZooKeeper
Zookeeper is essential for building distributed message queues.
It is a hierarchical key-value store, commonly used for a distributed configuration, synchronization service and naming registry (ie service discovery).
Redrawn · diagram-design
With this change, the broker only needs to maintain data for the messages. Metadata and state storage is in Zookeeper.
Zookeeper also helps with leader election of the broker replicas.
Replication
In distributed systems, hardware issues are inevitable. We can tackle this via replication to achieve high availability.
Redrawn · diagram-design
Each partition is replicated across multiple brokers, but there is only one leader replica.
Producers send messages to leader replicas
Followers pull the replicated messages from the leader
Once enough replicas are synchronized, the leader returns acknowledgment to the producer
Distribution of replicas for each partition is called the replica distribution plan.
The leader for a given partition creates the replica distribution plan and saves it in Zookeeper
In-sync replicas
One problem we need to tackle is keeping messages in-sync between the leader and the followers for a given partition.
In-sync replicas (ISR) are replicas for a partition that stay in-sync with the leader.
The replica.lag.max.messages defines how many messages can a replica be lagging behind the leader to be considered in-sync.
Redrawn · diagram-design
Committed offset is 13
Two new messages are written to the leader, but not committed yet.
A message is committed once all replicas in the ISR have synchronized that message
Replica 2 and 3 have fully caught up with leader, hence, they are in ISR
Replica 4 has lagged behind, hence, is removed from ISR for now
ISR reflects a trade-off between performance and durability.
In order for producers not to lose messages, all replicas should be in sync before sending an acknowledgment
But a slow replica will cause the whole partition to become unavailable
Acknowledgment handling is configurable.
ACK=all means that all replicas in ISR have to sync a message. Message sending is slow, but message durability is highest.
Redrawn · diagram-design
ACK=1 means that producer receives acknowledgment once leader receives the message. Message sending is fast, but message durability is low.
Redrawn · diagram-design
ACK=0 means that producer sends messages without waiting for any acknowledgment from leader. Message sending is fastest, message durability is lowest.
Redrawn · diagram-design
On the consumer side, we can connect all consumers to the leader for a partition and let them read messages from it:
This makes for the simplest design and easiest operation
Messages in a partition are sent to only one consumer in a group, which limits the connections to the leader replica
The number of connections to leader replica is typically not high as long as the topic is not super hot
We can scale a hot topic by increasing the number of partitions and consumers
In certain scenarios, it might make sense to let a consumer lead from an ISR, eg if they're located in a separate DC
The ISR list is maintained by the leader who tracks the lag between itself and each replica.
Scalability
Let's evaluate how we can scale different parts of the system.
Producer
The producer is much smaller than the consumer. Its scalability can easily be achieved by adding/removing new producer instances.
Consumer
Consumer groups are isolated from each other. It is easy to add/remove consumer groups at will.
Rebalancing help handle the case when consumers are added/removed from a group gracefully.
Consumer groups are rebalancing help us achieve scalability and fault tolerance.
Broker
How do brokers handle failure?
Redrawn · diagram-design
Once a broker fails, there are still enough replicas to avoid partition data loss
A new leader is elected and the broker coordinator redistributes partitions which were at the failed broker to existing replicas
Existing replicas pick up the new partitions and act as followers until they're caught up with the leader and become ISR
Additional considerations to make the broker fault-tolerant:
The minimum number of ISRs balances latency and safety. You can fine-tune it to meet your needs.
If all replicas of a partition are in the same node, then it's a waste of resources. Replicas should be across different brokers.
If all replicas of a partition crash, then the data is lost forever. Spreading replicas across data centers can help, but it adds up a lot of latency. One option is to use data mirroring as a work around.
How do we handle redistribution of replicas when a new broker is added?
Redrawn · diagram-design
We can temporarily allow more replicas than configured, until new broker catches up
Once it does, we can remove the partition replica which is no longer needed
Partition
Whenever a new partition is added, the producer is notified and consumer rebalancing is triggered.
In terms of data storage, we can only store new messages to the new partition vs. trying to copy all old ones:
Redrawn · diagram-design
Decreasing the number of partitions is more involved:
Redrawn · diagram-design
Once a partition is decommissioned, new messages are only received by remaining partitions
The decommissioned partition isn't removed immediately as messages can still be consumed from it
Once a pre-configured retention period passes, do we truncate the data and storage space is freed up
During the transitional period, producers only send messages to active partitions, but consumers read from all
Once retention period expires, consumers are rebalanced
Data delivery semantics
Let's discuss different delivery semantics.
At-most once
With this guarantee, messages are delivered not more than once and could not be delivered at all.
Redrawn · diagram-design
Producer sends a message asynchronously to a topic. If message delivery fails, there is no retry.
Consumer fetches message and immediately commits offset. If consumer crashes before processing the message, the message will not be processed.
At-least once
A message can be sent more than once and no message should be left unprocessed.
Redrawn · diagram-design
Producer sends message with ack=1 or ack=all. If there is any issue, it will keep retrying.
Consumer fetches the message and consumes the offset only after it's done processing it.
It is possible for a message to be delivered more than once if eg consumer crashes before committing offset but after processing it.
This is why, this is good for use-cases where data duplication is acceptable or deduplication is possible.
Exactly once
Extremely costly to implement for the system, albeit it's the friendliest guarantee to users:
Redrawn · diagram-design
Advanced features
Let's discuss some advanced features, we might discuss in the interview.
Message filtering
Some consumers might want to only consume messages of a certain type within a partition.
This can be achieved by building separate topics for each subset of messages, but this can be costly if systems have too many differing use-cases.
It is a waste of resources to store the same message on different topics
Producer is now tightly coupled to consumers as it changes with each new consumer requirement
We can resolve this using message filtering.
A naive approach would be to do the filtering on the consumer-side, but that introduces unnecessary consumer traffic
Alternatively, messages can have tags attached to them and consumers can specify which tags they're subscribed to
Filtering could also be done via the message payloads but that can be challenging and unsafe for encrypted/serialized messages
For more complex mathematical formulaes, the broker could implement a grammar parser or script executor, but that can be heavyweight for the message queue
Redrawn · diagram-design
Delayed messages & scheduled messages
For some use-cases, we might want to delay or schedule message delivery.
For example, we might submit a payment verification check for 30m from now, which triggers the consumer to see if a payment was successful.
This can be achieved by sending messages to temporary storage in the broker and moving the message to the partition at the right time:
Redrawn · diagram-design
The temporary storage can be one or more special message topics
The timing function can be achieved using dedicated delay queues or a hierarchical time wheel
Step 4: Wrap Up
Additional talking points:
Protocol of communication: Important considerations - support all use-cases and high data volume, as well as verify message integrity. Popular protocols - AMQP and Kafka protocol.
Retry consumption: if we can't process a message immediately, we could send it to a dedicated retry topic to be attempted later.
Historical data archive: old messages can be backed up in high-capacity storages such as HDFS or object storage (eg S3).
Chapter 20: Metrics Monitoring and Alerting System
Introduction
This chapter focuses on designing a highly scalable metrics monitoring and alerting system, which is critical for ensuring high availability and reliability.
Step 1: Understand the Problem and Establish Design Scope
A metrics monitoring system can mean a lot of different things - eg you don't want to design a logs aggregation system, when the interviewer is interested in infra metrics only.
Let's try to understand the problem first:
C: Who are we building the system for? An in-house monitoring system for a big tech company or a SaaS like DataDog?
I: We are building for internal use only.
C: Which metrics do we want to collect?
I: Operational system metrics - CPU load, Memory, Data disk space. But also high-level metrics like requests per second. Business metrics are not in scope.
C: What is the scale of the infrastructure we're monitoring?
I: 100mil daily active users, 1000 server pools, 100 machines per pool
C: How long should we keep the data?
I: Let's assume 1y retention.
C: May we reduce metrics data resolution for long-term storage?
I: Keep newly received metrics for 7 days. Roll them up to 1m resolution for next 30 days. Further roll them up to 1h resolution after 30 days.
C: What are the supported alert channels?
I: Email, phone, PagerDuty or webhooks.
C: Do we need to collect logs such as error or access logs?
I: No
C: Do we need to support distributed system tracing?
I: No
High-level requirements and assumptions
The infrastructure being monitored is large-scale:
100mil DAU
1000 server pools * 100 machines * ~100 metrics per machine -> ~10mil metrics
1-year data retention
Data retention policy - raw for 7d, 1-minute resolution for 30d, 1h resolution for 1y
A variety of metrics can be monitored:
CPU load
Request count
Memory usage
Message count in message queues
Non-functional requirements
Scalability: System should be scalable to accommodate more metrics and alerts
Low latency: System needs to have low query latency for dashboards and alerts
Reliability: System should be highly reliable to avoid missing critical alerts
Flexibility: System should be able to easily integrate new technologies in the future
What requirements are out of scope?
Log monitoring: the ELK stack is very popular for this use-case
Distributed system tracing: this refers to collecting data about a request lifecycle as it flows through multiple services within the system
Step 2: Propose High-Level Design and Get Buy-In
Fundamentals
There are five core components involved in a metrics monitoring and alerting system:
Redrawn · diagram-design
Data collection: collect metrics data from different sources
Data transmission: transfer data from sources to the metrics monitoring system
Data storage: organize and store incoming data
Alerting: Analyze incoming data, detect anomalies and generate alerts
Visualization: Present data in graphs, charts, etc
Data model
Metrics data is usually recorded as a time-series, which contains a set of values with timestamps.
The series can be identified by name and an optional set of tags.
Example 1 - What is the CPU load on production server instance i631 at 20:00?
Redrawn · diagram-design
The data can be identified by the following table:
Redrawn · diagram-design
The time series is identified by the metric name, labels and a single point in at a specific time.
Example 2 - What is the average CPU load across all web servers in the us-west region for the last 10min?
This is an example data we might pull from storage to answer that question.
The average CPU load can be calculated by averaging the values in the last column of the rows.
The format shown above is called the line protocol and is used by many popular monitoring software in the market - eg Prometheus, OpenTSDB.
What every time series consists of:
Redrawn · diagram-design
A good way to visualize how data looks like:
Redrawn · diagram-design
The x axis is the time
the y axis is the dimension you're querying - eg metric name, tag, etc.
The data access pattern is write-heavy and spiky reads as we collect a lot of metrics, but they are infrequently accessed, although in bursts when eg there are ongoing incidents.
The data storage system is the heart of this design.
It is not recommended to use a general-purpose database for this problem, although you could achieve good scale \w expert-level tuning.
Using a NoSQL database can work in theory, but it is hard to devise a scalable schema for effectively storing and querying time-series data.
There are many databases, specifically tailored for storing time-series data. Many of them support custom query interfaces which allow for effective querying of time-series data.
OpenTSDB is a distributed time-series database, but it is based on Hadoop and HBase. If you don't have that infrastructure provisioned, it would be hard to use this tech.
Twitter uses MetricsDB, while Amazon offers Timestream.
The two most popular time-series databases are InfluxDB and Prometheus.
They are designed to store large volumes of time-series data. Both of them are based on in-memory cache + on-disk storage.
Example scale of InfluxDB - more than 250k writes per second when provisioned with 8 cores and 32gb RAM:
Redrawn · diagram-design
It is not expected for you to understand the internals of a metrics database as it is niche knowledge. You might be asked only if you've mentioned it on your resume.
For the purposes of the interview, it is sufficient to understand that metrics are time-series data and to be aware of popular time-series databases, like InfluxDB.
One nice feature of time-series databases is the efficient aggregation and analysis of large amounts of time-series data by labels.
InfluxDB, for example, builds indexes for each label.
It is critical, however, to keep the cardinality of labels low - ie, not using too many unique labels.
High-level Design
Redrawn · diagram-design
Metrics source: can be application servers, SQL databases, message queues, etc.
Metrics collector: Gathers metrics data and writes to time-series database
Time-series database: stores metrics as time-series. Provides a custom query interface for analyzing large amounts of metrics.
Query service: Makes it easy to query and retrieve data from the time-series DB. Could be replaced entirely by the DB's interface if it's sufficiently powerful.
Alerting system: Sends alert notifications to various alerting destinations.
Visualization system: Shows metrics in the form of graphs/charts.
Step 3: Design Deep Dive
Let's deep dive into several of the more interesting parts of the system.
Metrics collection
For metrics collection, occasional data loss is not critical. It's acceptable for clients to fire and forget.
Redrawn · diagram-design
There are two ways to implement metrics collection - pull or push.
Here's how the pull model might look like:
Redrawn · diagram-design
For this solution, the metrics collector needs to maintain an up-to-date list of services and metrics endpoints.
We can use Zookeeper or etcd for that purpose - service discovery.
Service discovery contains contains configuration rules about when and where to collect metrics from:
Redrawn · diagram-design
Here's a detailed explanation of the metrics collection flow:
Redrawn · diagram-design
Metrics collector fetches configuration metadata from service discovery. This includes pulling interval, IP addresses, timeout & retry params.
Metrics collector pulls metrics data via a pre-defined http endpoint (eg /metrics). This is typically done by a client library.
Alternatively, the metrics collector can register a change event notification with the service discovery to be notified once the service endpoint changes.
Another option is for the metrics collector to periodically poll for metrics endpoint configuration changes.
At our scale, a single metrics collector is not enough. There must be multiple instances.
However, there must also be some kind of synchronization among them so that two collectors don't collect the same metrics twice.
One solution for this is to position collectors and servers on a consistent hash ring and associate a set of servers with a single collector only:
Redrawn · diagram-design
With the push model, on the other hand, services push their metrics to the metrics collector proactively:
Redrawn · diagram-design
In this approach, typically a collection agent is installed alongside service instances.
The agent collects metrics from the server and pushes them to the metrics collector.
Redrawn · diagram-design
With this model, we can potentially aggregate metrics before sending them to the collector, which reduces the volume of data processed by the collector.
On the flip side, metrics collector can reject push requests as it can't handle the load.
It is important, hence, to add the collector to an auto-scaling group behind a load balancer.
so which one is better? There are trade-offs between both approaches and different systems use different approaches:
Prometheus uses a pull architecture
Amazon Cloud Watch and Graphite use a push architecture
Here are some of the main differences between push and pull:
Pull
Push
Easy debugging
The /metrics endpoint on application servers used for pulling metrics can be used to view metrics at any time. You can even do this on your laptop. Pull wins.
If the metrics collector doesn't receive metrics, the problem might be caused by network issues.
Health check
If an application server doesn't respond to the pull, you can quickly figure out if an application server is down. Pull wins.
If the metrics collector doesn't receive metrics, the problem might be caused by network issues.
Short-lived jobs
Some of the batch jobs might be short-lived and don't last long enough to be pulled. Push wins. This can be fixed by introducing push gateways for the pull model [22].
Firewall or complicated network setups
Having servers pulling metrics requires all metric endpoints to be reachable. This is potentially problematic in multiple data center setups. It might require a more elaborate network infrastructure.
If the metrics collector is set up with a load balancer and an auto-scaling group, it is possible to receive data from anywhere. Push wins.
Performance
Pull methods typically use TCP.
Push methods typically use UDP. This means the push method provides lower-latency transports of metrics. The counterargument here is that the effort of establishing a TCP connection is small compared to sending the metrics payload.
Data authenticity
Application servers to collect metrics from are defined in config files in advance. Metrics gathered from those servers are guaranteed to be authentic.
Any kind of client can push metrics to the metrics collector. This can be fixed by whitelisting servers from which to accept metrics, or by requiring authentication.
There is no clear winner. A large organization probably needs to support both. There might not be a way to install a push agent in the first place.
Scale the metrics transmission pipeline
Redrawn · diagram-design
The metrics collector is provisioned in an auto-scaling group, regardless if we use the push or pull model.
There is a chance of data loss if the time-series DB is down, however. To mitigate this, we'll provision a queuing mechanism:
Redrawn · diagram-design
Metrics collectors push metrics data into kafka
Consumers or stream processing services such as Apache Storm, Flink or Spark process the data and push it to the time-series DB
This approach has several advantages:
Kafka is used as a highly-reliable and scalable distributed message platform
It decouples data collection and data processing from one another
It can prevent data loss by retaining the data in Kafka
Kafka can be configured with one partition per metric name, so that consumers can aggregate data by metric names.
To scale this, we can further partition by tags/labels and categorize/prioritize metrics to be collected first.
Redrawn · diagram-design
The main downside of using Kafka for this problem is the maintenance/operation overhead.
An alternative is to use a large-scale ingestion system like Gorilla.
It can be argued that using that would be as scalable as using Kafka for queuing.
Where aggregations can happen
Metrics can be aggregated at several places. There are trade-offs between different choices:
Collection agent: client-side collection agent only supports simple aggregation logic. Eg collect a counter for 1m and send it to the metrics collector.
Ingestion pipeline: To aggregate data before writing to the DB, we need a stream processing engine like Flink. This reduces write volume, but we lose data precision as we don't store raw data.
Query side: We can aggregate data when we run queries via our visualization system. There is no data loss, but queries can be slow due to a lot of data processing.
Query Service
Having a separate query service from the time-series DB decouples the visualization and alerting system from the database, which enables us to decouple the DB from clients and change it at will.
We can add a Cache layer here to reduce the load to the time-series database:
Redrawn · diagram-design
We can also avoid adding a query service altogether as most visualization and alerting systems have powerful plugins to integrate with most time-series databases.
With a well-chosen time-series DB, we might not need to introduce our own caching layer as well.
Most time-series DBs don't support SQL simply because it is ineffective for querying time-series data. Here's an example SQL query for computing an exponential moving average:
select id,
       temp,
       avg(temp) over (partition by group_nr order by time_read) as rolling_avg
from (
  select id,
         temp,
         time_read,
         interval_group,
         id - row_number() over (partition by interval_group order by time_read) as group_nr
  from (
    select id,
    time_read,
    "epoch"::timestamp + "900 seconds"::interval * (extract(epoch from time_read)::int4 / 900) as interval_group,
    temp
    from readings
  ) t1
) t2
order by time_read;
Here's the same query in Flux - query language used in InfluxDB:
It is important to choose the time-series database carefully.
According to research published by Facebook, ~85% of queries to the operational store were for data from the past 26h.
If we choose a database, which harnesses this property, it could have significant impact on system performance. InfluxDB is one such option.
Regardless of the database we choose, there are some optimizations we might employ.
Data encoding and compression can significantly reduce the size of data. Those features are usually built into a good time-series database.
Redrawn · diagram-design
In the above example, instead of storing full timestamps, we can store timestamp deltas.
Another technique we can employ is down-sampling - converting high-resolution data to low-resolution in order to reduce disk usage.
We can use that for old data and make the rules configurable by data scientists, eg:
7d - no down-sampling
30d - down-sample to 1min
1y - down-sample to 1h
For example, here's a 10-second resolution metrics table:
metric
timestamp
hostname
Metric_value
cpu
2021-10-24T19:00:00Z
host-a
10
cpu
2021-10-24T19:00:10Z
host-a
16
cpu
2021-10-24T19:00:20Z
host-a
20
cpu
2021-10-24T19:00:30Z
host-a
30
cpu
2021-10-24T19:00:40Z
host-a
20
cpu
2021-10-24T19:00:50Z
host-a
30
down-sampled to 30-second resolution:
metric
timestamp
hostname
Metric_value (avg)
cpu
2021-10-24T19:00:00Z
host-a
19
cpu
2021-10-24T19:00:30Z
host-a
25
Finally, we can also use cold storage to use old data, which is no longer used. The financial cost for cold storage is much lower.
Alerting system
Redrawn · diagram-design
Configuration is loaded to cache servers. Rules are typically defined in YAML format. Here's an example:
- name: instance_down
  rules:

  # Alert for any instance that is unreachable for >5 minutes.
  - alert: instance_down
    expr: up == 0
    for: 5m
    labels:
      severity: page
The alert manager fetches alert configurations from cache. Based on configuration rules, it also calls the query service at a predefined interval.
If a rule is met, an alert event is created.
Other responsibilities of the alert manager are:
Filtering, merging and deduplicating alerts. Eg if an alert of a single instance is triggered multiple times, only one alert event is generated.
Access control - it is important to restrict alert-management operations to certain individuals only
Retry - the manager ensures that the alert is propagated at least once.
The alert store is a key-value database, like Cassandra, which keeps the state of all alerts. It ensures a notification is sent at least once.
Once an alert is triggered, it is published to Kafka.
Finally, alert consumers pull alerts data from Kafka and send notifications over to different channels - Email, text message, PagerDuty, webhooks.
In the real-world, there are many off-the-shelf solutions for alerting systems. It is difficult to justify building your own system in-house.
Visualization system
The visualization system shows metrics and alerts over a time period. Here's an dashboard built with Grafana:
Redrawn · diagram-design
A high-quality visualization system is very hard to build. It is hard to justify not using an off-the-shelf solution like Grafana.
Step 4: Wrap up
Here's our final design:
Redrawn · diagram-design
Chapter 21: Ad Click Event Aggregation
Introduction
Digital advertising is a big industry with the rise of Facebook, YouTube, TikTok, etc.
Hence, tracking ad click events is important. In this chapter, we explore how to design an ad click event aggregation system at Facebook/Google scale.
Digital advertising has a process called real-time bidding (RTB), where digital advertising inventory is bought and sold:
Redrawn · diagram-design
Speed of RTB is important as it usually occurs within a second.
Data accuracy is also very important as it impacts how much money advertisers pay.
Based on ad click event aggregations, advertisers can make decisions such as adjust target audience and keywords.
Step 1: Understand the Problem and Establish Design Scope
C: What is the format of the input data?
I: 1bil ad clicks per day and 2mil ads in total. Number of ad-click events grows 30% year-over-year.
C: What are some of the most important queries our system needs to support?
I: Top queries to take into consideration:
Return number of click events for ad X in last Y minutes
Return top 100 most clicked ads in the past 1min. Both parameters should be configurable. Aggregation occurs every minute.
Support data filtering by ip, user_id, country for the above queries
C: Do we need to worry about edge cases? Some of the ones I can think of:
There might be events that arrive later than expected
There might be duplicate events
Different parts of the system might be down, so we need to consider system recovery
I: That's a good list, take those into consideration
C: What is the latency requirement?
I: A few minutes of e2e latency for ad click aggregation. For RTB, it is less than a second. It is ok to have that latency for ad click aggregation as those are usually used for billing and reporting.
Functional requirements
Aggregate the number of clicks of ad_id in the last Y minutes
Return top 100 most clicked ad_id every minute
Support aggregation filtering by different attributes
Dataset volume is at Facebook or Google scale
Non-functional requirements
Correctness of the aggregation result is important as it's used for RTB and ads billing
Properly handle delayed or duplicate events
Robustness - system should be resilient to partial failures
Latency - a few minutes of e2e latency at most
Back-of-the-envelope estimation
1bil DAU
Assuming user clicks 1 ad per day -> 1bil ad clicks per day
Ad click QPS = 10,000
Peak QPS is 5 times the number = 50,000
A single ad click occupies 0.1KB storage. Daily storage requirement is 100gb
Monthly storage = 3tb
Step 2: Propose High-Level Design and Get Buy-In
In this section, we discuss query API design, data model and high-level design.
Query API Design
The API is a contract between the client and the server. In our case, the client is the dashboard user - data scientist/analyst, advertiser, etc.
Here's our functional requirements:
Aggregate the number of clicks of ad_id in the last Y minutes
Return top N most clicked ad_id in the last M minutes
Support aggregation filtering by different attributes
We need two endpoints to achieve those requirements. Filtering can be done via query parameters on one of them.
Aggregate number of clicks of ad_id in the last M minutes:
GET /v1/ads/{:ad_id}/aggregated_count
Query parameters:
from - start minute. Default is now - 1 min
to - end minute. Default is now
filter - identifier for different filtering strategies. Eg 001 means "non-US clicks".
Response:
ad_id - ad identifier
count - aggregated count between start and end minutes
Return top N most clicked ad_ids in the last M minutes
GET /v1/ads/popular_ads
Query parameters:
count - top N most clicked ads
window - aggregation window size in minutes
filter - identifier for different filtering strategies
Response:
list of ad_ids
Data model
In our system, we have raw and aggregated data.
Raw data looks like this:
[AdClickEvent] ad001, 2021-01-01 00:00:01, user 1, 207.148.22.22, USA
Here's an example in a structured format:
ad_id
click_timestamp
user
ip
country
ad001
2021-01-01 00:00:01
user1
207.148.22.22
USA
ad001
2021-01-01 00:00:02
user1
207.148.22.22
USA
ad002
2021-01-01 00:00:02
user2
209.153.56.11
USA
Here's the aggregated version:
ad_id
click_minute
filter_id
count
ad001
202101010000
0012
2
ad001
202101010000
0023
3
ad001
202101010001
0012
1
ad001
202101010001
0023
6
The filter_id helps us achieve our filtering requirements.
filter_id
region
IP
user_id
0012
US
*
*
0013
*
123.1.2.3
*
To support quickly returning top N most clicked ads in the last M minutes, we'll also maintain this structure:
most_clicked_ads
window_size
integer
The aggregation window size (M) in minutes
update_time_minute
timestamp
Last updated timestamp (in 1-minute granularity)
most_clicked_ads
array
List of ad IDs in JSON format.
What are some pros and cons between storing raw data and storing aggregated data?
Raw data enables using the full data set and supports data filtering and recalculation
On the other hand, aggregated data allows us to have a smaller data set and a faster query
Raw data means having a larger data store and a slower query
Aggregated data, however, is derived data, hence there is some data loss.
In our design, we'll use a combination of both approaches:
It's a good idea to keep the raw data around for debugging. If there is some bug in aggregation, we can discover the bug and backfill.
Aggregated data should be stored as well for faster query performance.
Raw data can be stored in cold storage to avoid extra storage costs.
When it comes to the database, there are several factors to take into consideration:
What does the data look like? Is it relational, document or blob?
Is the workload read-heavy, write-heavy or both?
Are transactions needed?
Do the queries rely on OLAP functions like SUM and COUNT?
For the raw data, we can see that the average QPS is 10k and peak QPS is 50k, so the system is write-heavy.
On the other hand, read traffic is low as raw data is mostly used as backup if anything goes wrong.
Relational databases can do the job, but it can be challenging to scale the writes.
Alternatively, we can use Cassandra or InfluxDB which have better native support for heavy write loads.
Another option is to use Amazon S3 with a columnar data format like ORC, Parquet or AVRO. Since this setup is unfamiliar, we'll stick to Cassandra.
For aggregated data, the workload is both read and write heavy as aggregated data is constantly queried for dashboards and alerts.
It is also write-heavy as data is aggregated and written every minute by the aggregation service.
Hence, we'll use the same data store (Cassandra) here as well.
High-level design
Here's how our system looks like:
Redrawn · diagram-design
Data flows as an unbounded data stream on both inputs and outputs.
In order to avoid having a synchronous sink, where a consumer crashing can cause the whole system to stall,
we'll leverage asynchronous processing using message queues (Kafka) to decouple consumers and producers.
Redrawn · diagram-design
The first message queue stores ad click event data:
ad_id
click_timestamp
user_id
ip
country
The second message queue contains ad click counts, aggregated per-minute:
ad_id
click_minute
count
As well as top N clicked ads aggregated per minute:
update_time_minute
most_clicked_ads
The second message queue is there in order to achieve end to end exactly-once atomic commit semantics:
Redrawn · diagram-design
For the aggregation service, using the MapReduce framework is a good option:
Redrawn · diagram-design
Redrawn · diagram-design
Each node is responsible for one single task and it sends the processing result to the downstream node.
The map node is responsible for reading from the data source, then filtering and transforming the data.
For example, the map node can allocate data across different aggregation nodes based on the ad_id:
Redrawn · diagram-design
Alternatively, we can distribute ads across Kafka partitions and let the aggregation nodes subscribe directly within a consumer group.
However, the mapping node enables us to sanitize or transform the data before subsequent processing.
Another reason might be that we don't have control over how data is produced,
so events related to the same ad_id might go on different partitions.
The aggregate node counts ad click events by ad_id in-memory every minute.
The reduce node collects aggregated results from aggregate node and produces the final result:
Redrawn · diagram-design
This DAG model uses the MapReduce paradigm. It takes big data and leverages parallel distributed computing to turn it into regular-sized data.
In the DAG model, intermediate data is stored in-memory and different nodes communicate with each other using TCP or shared memory.
Let's explore how this model can now help us to achieve our various use-cases.
Use-case 1 - aggregate the number of clicks:
Redrawn · diagram-design
Ads are partitioned using ad_id % 3
Use-case 2 - return top N most clicked ads:
Redrawn · diagram-design
In this case, we're aggregating the top 3 ads, but this can be extended to top N ads easily
Each node maintains a heap data structure for fast retrieval of top N ads
Use-case 3 - data filtering:
To support fast data filtering, we can predefine filtering criterias and pre-aggregate based on it:
ad_id
click_minute
country
count
ad001
202101010001
USA
100
ad001
202101010001
GPB
200
ad001
202101010001
others
3000
ad002
202101010001
USA
10
ad002
202101010001
GPB
25
ad002
202101010001
others
12
This technique is called the star schema and is widely used in data warehouses.
The filtering fields are called dimensions.
This approach has the following benefits:
Simple to undertand and build
Current aggregation service can be reused to create more dimensions in the star schema.
Accessing data based on filtering criteria is fast as results are pre-calculated
A limitation of this approach is that it creates many more buckets and records, especially when we have lots of filtering criterias.
Step 3: Design Deep Dive
Let's dive deeper into some of the more interesting topics.
Streaming vs. Batching
The high-level architecture we proposed is a type of stream processing system.
Here's a comparison between three types of systems:
Services (Online system)
Batch system (offline system)
Streaming system (near real-time system)
Responsiveness
Respond to the client quickly
No response to the client needed
No response to the client needed
Input
User requests
Bounded input with finite size. A large amount of data
Input has no boundary (infinite streams)
Output
Responses to clients
Materialized views, aggregated metrics, etc.
Materialized views, aggregated metrics, etc.
Performance measurement
Availability, latency
Throughput
Throughput, latency
Example
Online shopping
MapReduce
Flink [13]
In our design, we used a mixture of batching and streaming.
We used streaming for processing data as it arrives and generates aggregated results in near real-time.
We used batching, on the other hand, for historical data backup.
A system which contains two processing paths - batch and streaming, simultaneously, this architecture is called lambda.
A disadvantage is that you have two processing paths with two different codebases to maintain.
Kappa is an alternative architecture, which combines batch and stream processing in one processing path.
The key idea is to use a single stream processing engine.
Lambda architecture:
Redrawn · diagram-design
Kappa architecture:
Redrawn · diagram-design
Our high-level design uses Kappa architecture as reprocessing of historical data also goes through the aggregation service.
Whenever we have to recalculate aggregated data due to eg a major bug in aggregation logic, we can recalculate the aggregation from the raw data we store.
Recalculation service retrieves data from raw storage. This is a batch job.
Retrieved data is sent to a dedicated aggregation service, so that the real-time processing aggregation service is not impacted.
Aggregated results are sent to the second message queue, after which we update the results in the aggregation database.
Redrawn · diagram-design
Time
We need a timestamp to perform aggregation. It can be generated in two places:
event time - when ad click occurs
Processing time - system time when the server processes the event
Due to the usage of async processing (message queues) and network delays, there can be significant difference between event time and processing time.
If we use processing time, aggregation results can be inaccurate
If we use event time, we have to deal with delayed events
There is no perfect solution, we need to consider trade-offs:
Pros
Cons
Event time
Aggregation results are more accurate
Clients might have the wrong time or timestamp might be generated by malicious users
Processing time
Server timestamp is more reliable
The timestamp is not accurate if event is late
Since data accuracy is important, we'll use the event time for aggregation.
To mitigate the issue of delayed events, a technique called "watermark" can be leveraged.
In the example below, event 2 misses the window where it needs to be aggregated:
Redrawn · diagram-design
However, if we purposefully extend the aggregation window, we can reduce the likelihood of missed events.
The extended part of a window is called a "watermark":
Redrawn · diagram-design
Short watermark increases likelihood of missed events, but reduces latency
Longer watermark reduces likelihood of missed events, but increases latency
There is always likelihood of missed events, regardless of the watermark's size. But there is no use in optimizing for such low-probability events.
We can instead resolve such inconsistencies by doing end-of-day reconciliation.
Aggregation window
There are four types of window functions:
Tumbling (fixed) window
Hopping window
Sliding window
Session window
In our design, we leverage a tumbling window for ad click aggregations:
Redrawn · diagram-design
As well as a sliding window for the top N clicked ads in M minutes aggregation:
Redrawn · diagram-design
Delivery guarantees
Since the data we're aggregating is going to be used for billing, data accuracy is a priority.
Hence, we need to discuss:
How to avoid processing duplicate events
How to ensure all events are processed
There are three delivery guarantees we can use - at-most-once, at-least-once and exactly once.
In most circumstances, at-least-once is sufficient when a small amount of duplicates is acceptable.
This is not the case for our system, though, as a difference in small percent can result in millions of dollars of discrepancy.
Hence, we'll need to use exactly-once delivery semantics.
Data deduplication
One of the most common data quality issues is duplicated data.
It can come from a wide range of sources:
Client-side - a client might resend the same event multiple times. Duplicated events sent with malicious intent are best handled by a risk engine.
Server outage - An aggregation service node goes down in the middle of aggregation and the upstream service hasn't received an acknowledgment so event is resent.
Here's an example of data duplication occurring due to failure to acknowledge an event on the last hop:
Redrawn · diagram-design
In this example, offset 100 will be processed and sent downstream multiple times.
One option to try and mitigate this is to store the last seen offset in HDFS/S3, but this risks the result never reaching downstream:
Redrawn · diagram-design
Finally, we can store the offset while interacting with downstream atomically. To achieve this, we need to implement a distributed transaction:
Redrawn · diagram-design
Personal side-note: Alternatively, if the downstream system handles the aggregation result idempotently, there is no need for a distributed transaction.
Scale the system
Let's discuss how we scale the system as it grows.
We have three independent components - message queue, aggregation service and database.
Since they are decoupled, we can scale them independently.
How do we scale the message queue:
We don't put a limit on producers, so they can be scaled easily
Consumers can be scaled by assigning them to consumer groups and increasing the number of consumers.
For this to work, we also need to ensure there are enough partitions created preemptively
Also, consumer rebalancing can take a while when there are thousands of consumers so it is recommended to do it off peak hours
We could also consider partitioning the topic by geography, eg topic_na, topic_eu, etc.
Redrawn · diagram-design
How do we scale the aggregation service:
Redrawn · diagram-design
The map-reduce nodes can easily be scaled by adding more nodes
The throughput of the aggregation service can be scaled by by utilising multi-threading
Alternatively, we can leverage resource providers such as Apache YARN to utilize multi-processing
Option 1 is easier, but option 2 is more widely used in practice as it's more scalable
Here's the multi-threading example:
Redrawn · diagram-design
How do we scale the database:
If we use Cassandra, it natively supports horizontal scaling utilizing consistent hashing
If a new node is added to the cluster, data automatically gets rebalanced across all (virtual) nodes
With this approach, no manual (re)sharding is required
Redrawn · diagram-design
Another scalability issue to consider is the hotspot issue - what if an ad is more popular and gets more attention than others?
Redrawn · diagram-design
In the above example, aggregation service nodes can apply for extra resources via the resource manager
The resource manager allocates more resources, so the original node isn't overloaded
The original node splits the events into 3 groups and each of the aggregation nodes handles 100 events
Result is written back to the original aggregation node
Alternative, more sophisticated ways to handle the hotspot problem:
Global-Local Aggregation
Split Distinct Aggregation
Fault Tolerance
Within the aggregation nodes, we are processing data in-memory. If a node goes down, the processed data is lost.
We can leverage consumer offsets in kafka to continue from where we left off once another node picks up the slack.
However, there is additional intermediary state we need to maintain, as we're aggregating the top N ads in M minutes.
We can make snapshots at a particular minute for the on-going aggregation:
Redrawn · diagram-design
If a node goes down, the new node can read the latest committed consumer offset, as well as the latest snapshot to continue the job:
Redrawn · diagram-design
Data monitoring and correctness
As the data we're aggregating is critical as it's used for billing, it is very important to have rigorous monitoring in place in order to ensure correctness.
Some metrics we might want to monitor:
Latency: Timestamps of different events can be tracked in order to understand the e2e latency of the system
Message queue size: If there is a sudden increase in queue size, we need to add more aggregation nodes. As Kafka is implemented via a distributed commit log, we need to keep track of records-lag metrics instead.
System resources on aggregation nodes: CPU, disk, JVM, etc.
We also need to implement a reconciliation flow which is a batch job, running at the end of the day.
It calculates the aggregated results from the raw data and compares them against the actual data stored in the aggregation database:
Redrawn · diagram-design
Alternative design
In a generalist system design interview, you are not expected to know the internals of specialized software used in big data processing.
Explaining the thought process and discussing trade-offs is more important than knowing specific tools, which is why the chapter covers a generic solution.
An alternative design, which leverages off-the-shelf tooling, is to store ad click data in Hive with an ElasticSearch layer on top built for faster queries.
Aggregation is typically done in OLAP databases such as ClickHouse or Druid.
Redrawn · diagram-design
Step 4: Wrap up
Things we covered:
Data model and API Design
Using MapReduce to aggregate ad click events
Scaling the message queue, aggregation service and database
Mitigating the hotspot issue
Monitoring the system continuously
Using reconciliation to ensure correctness
Fault tolerance
The ad click event aggregation is a typical big data processing system.
It would be easier to understand and design it if you have prior knowledge of related technologies:
Apache Kafka
Apache Spark
Apache Flink
Chapter 22: Hotel Reservation System
Introduction
In this chapter, we're designing a hotel reservation system, similar to Marriott International.
Applicable to other types of systems as well - Airbnb, flight reservation, movie ticket booking.
Step 1: Understand the Problem and Establish Design Scope
Before diving into designing the system, we should ask the interviewer questions to clarify the scope:
C: What is the scale of the system?
I: We're building a website for a hotel chain \w 5000 hotels and 1mil rooms
C: Do customers pay when they make a reservation or when they arrive at the hotel?
I: They pay in full when making reservations.
C: Do customers book hotel rooms through the website only? Do we have to support other reservation options such as phone calls?
I: They make bookings through the website or app only.
C: Can customers cancel reservations?
I: Yes
C: Other things to consider?
I: Yes, we allow overbooking by 10%. Hotel will sell more rooms than there actually are. Hotels do this in anticipation that clients will cancel bookings.
C: Since not much time, we'll focus on - show hotel-related page, hotel-room details page, reserve a room, admin panel, support overbooking.
I: Sounds good.
I: One more thing - hotel prices change all the time. Assume a hotel room's price changes every day.
C: OK.
Non-functional requirements
Support high concurrency - there might be a lot of customers trying to book the same hotel during peak season.
Moderate latency - it's ideal to have low latency when a user makes a reservation, but it's acceptable if the system takes a few seconds to process it.
Back-of-the-envelope estimation
5000 hotels and 1mil rooms in total
Assume 70% of rooms are occupied and average stay duration is 3 days
Estimated daily reservations - 1mil * 0.7 / 3 = ~240k reservations per day
Reservations per second - 240k / 10^5 seconds in a day = ~3. Average reservation TPS is low.
Let's estimate the QPS. If we assume that there are three steps to reach the reservation page and there is a 10% conversion rate per page,
we can estimate that if there are 3 reservations, then there must be 30 views of reservation page and 300 views of hotel room detail page.
Redrawn · diagram-design
Step 2: Propose High-Level Design and Get Buy-In
We'll explore - API Design, Data model, high-level design.
API Design
This API Design focuses on the core endpoints (using RESTful practices), we'll need in order to support a hotel reservation system.
A fully-fledged system would require a more extensive API with support for searching for rooms based on lots of criteria, but we won't be focusing on that in this section.
Reason is that they aren't technically challenging, so they're out of scope.
Hotel-related API
GET /v1/hotels/{id} - get detailed info about a hotel
POST /v1/hotels - add a new hotel. Only available to ops
PUT /v1/hotels/{id} - update hotel info. Only available to ops
DELETE /v1/hotels/{id} - delete a hotel. API is only available to ops
Room-related API
GET /v1/hotels/{id}/rooms/{id} - get detailed information about a room
POST /v1/hotels/{id}/rooms - Add a room. Only available to ops
PUT /v1/hotels/{id}/rooms/{id} - Update room info. Only available to ops
DELETE /v1/hotels/{id}/rooms/{id} - Delete a room. Only available to ops
Reservation-related API
GET /v1/reservations - get reservation history of current user
GET /v1/reservations/{id} - get detailed info about a reservation
POST /v1/reservations - make a new reservation
DELETE /v1/reservations/{id} - cancel a reservation
Note that the reservationID is an idempotency key to avoid double booking. Details explained in concurrency section
Data model
Before we choose what database to use, let's consider our access patterns.
We need to support the following queries:
View detailed info about a hotel
Find available types of rooms given a date range
Record a reservation
Look up a reservation or past history of reservations
From our estimations, we know the scale of the system is not large, but we need to prepare for traffic surges.
Given this knowledge, we'll choose a relational database because:
Relational DBs work well with read-heavy and less write-heavy systems.
NoSQL databases are normally optimized for writes, but we know we won't have many as only a fraction of users who visit the site make a reservation.
Relational DBs provide ACID guarantees. These are important for such a system as without them, we won't be able to prevent problems such as negative balance, double charge, etc.
Relational DBs can easily model the data as the structure is very clear.
Here is our schema design:
Redrawn · diagram-design
Most fields are self-explanatory. Only field worth mentioning is the status field which represents the state machine of a given room:
Redrawn · diagram-design
This data model works well for a system like Airbnb, but not for hotels where users don't reserve a particular room but a room type.
They reserve a type of room and a room number is chosen at the point of reservation.
We've chosen a microservice architecture for this design. It has gained great popularity in recent years:
Redrawn · diagram-design
Users: book a hotel room on their phone or computer
Admin: perform administrative functions such as refunding/cancelling a payment, etc
CDN: caches static resources such as JS bundles, images, videos, etc
Public API Gateway: fully-managed service which supports rate limiting, authentication, etc.
Internal APIs: only visible to authorized personnel. Usually protected by a VPN.
Hotel service: provides detailed information about hotels and rooms. Hotel and room data is static, so it can be cached aggressively.
Rate service: provides room rates for different future dates. An interesting note about this domain is that prices depend on how full a hotel is at a given day.
Reservation service: receives reservation requests and reserves hotel rooms. Also tracks room inventory as reservations are made/cancelled.
Payment service: processes payments and updates reservation statuses on success.
Hotel management service: available to authorized personnel only. Allows certain administrative functions for managing and viewing reservations, hotels, etc.
Inter-service communication can be facilitated via a RPC framework, such as gRPC.
Step 3: Design Deep Dive
Let's dive deeper into:
Improved data model
Concurrency issues
Scalability
Resolving data inconsistency in microservices
Improved data model
As mentioned in a previous section, we need to amend our API and schema to enable reserving a type of room vs. a particular one.
For the reservation API, we no longer reserve a roomID, but we reserve a roomTypeID:
POST /v1/reservations
{
  "startDate":"2021-04-28",
  "endDate":"2021-04-30",
  "hotelID":"245",
  "roomTypeID":"12354673389",
  "roomCount":"3",
  "reservationID":"13422445"
}
Here's the updated schema:
Redrawn · diagram-design
room: contains information about a room
room_type_rate: contains information about prices for a given room type
reservation: records guest reservation data
room_type_inventory: stores inventory data about hotel rooms.
Let's take a look at the room_type_inventory columns as that table is more interesting:
hotel_id: id of hotel
room_type_id: id of a room type
date: a single date
total_inventory: total number of rooms minus those that are temporarily taken off the inventory.
total_reserved: total number of rooms booked for given (hotel_id, room_type_id, date)
There are alternative ways to design this table, but having one room per (hotel_id, room_type_id, date) enables easy
reservation management and easier queries.
The rows in the table are pre-populated using a daily CRON job.
Sample data:
hotel_id
room_type_id
date
total_inventory
total_reserved
211
1001
2021-06-01
100
80
211
1001
2021-06-02
100
82
211
1001
2021-06-03
100
86
211
1001
...
...
211
1001
2023-05-31
100
0
211
1002
2021-06-01
200
16
2210
101
2021-06-01
30
23
2210
101
2021-06-02
30
25
Sample SQL query to check the availability of a type of room:
SELECT date, total_inventory, total_reserved
FROM room_type_inventory
WHERE room_type_id = ${roomTypeId} AND hotel_id = ${hotelId}
AND date between ${startDate} and ${endDate}
How to check availability for a specified number of rooms using that data (note that we support overbooking):
if (total_reserved + ${numberOfRoomsToReserve}) <= 110% * total_inventory
Now let's do some estimation about the storage volume.
We have 5000 hotels.
Each hotel has 20 types of rooms.
5000 * 20 * 2 (years) * 365 (days) = 73mil rows
73 million rows is not a lot of data and a single database server can handle it.
It makes sense, however, to setup read replication (potentially across different zones) to enable high availability.
Follow-up question - if reservation data is too large for a single database, what would you do?
Store only current and future reservation data. Reservation history can be moved to cold storage.
Database sharding - we can shard our data by hash(hotel_id) % servers_cnt as we always select the hotel_id in our queries.
Concurrency issues
Another important problem to address is double booking.
There are two issues to address:
Same user clicks on "book" twice
Multiple users try to book a room at the same time
Here's a visualization of the first problem:
Redrawn · diagram-design
There are two approaches to solving this problem:
Client-side handling - front-end can disable the book button once clicked. If a user disabled javascript, however, they won't see the button becoming grayed out.
Idemptent API - Add an idempotency key to the API, which enables a user to execute an action once, regardless of how many times the endpoint is invoked:
Redrawn · diagram-design
Here's how this flow works:
A reservation order is generated once you're in the process of filling in your details and making a booking. The reservation order is generated using a globally unique identifier.
Submit reservation 1 using the reservation_id generated in the previous step.
If "complete booking" is clicked a second time, the same reservation_id is sent and the backend detects that this is a duplicate reservation.
The duplication is avoided by making the reservation_id column have a unique constraint, preventing multiple records with that id being stored in the DB.
Redrawn · diagram-design
What if there are multiple users making the same reservation?
Redrawn · diagram-design
Let's assume the transaction isolation level is not serializable
User 1 and 2 attempt to book the same room at the same time.
Transaction 1 checks if there are enough rooms - there are
Transaction 2 check if there are enough rooms - there are
Transaction 2 reserves the room and updates the inventory
Transaction 1 also reserves the room as it still sees there are 99 total_reserved rooms out of 100.
Both transactions successfully commit the changes
This problem can be solved using some form of locking mechanism:
Pessimistic locking
Optimistic locking
Database constraints
Here's the SQL we use to reserve a room:
# step 1: check room inventory
SELECT date, total_inventory, total_reserved
FROM room_type_inventory
WHERE room_type_id = ${roomTypeId} AND hotel_id = ${hotelId}
AND date between ${startDate} and ${endDate}

# For every entry returned from step 1
if((total_reserved + ${numberOfRoomsToReserve}) > 110% * total_inventory) {
  Rollback
}

# step 2: reserve rooms
UPDATE room_type_inventory
SET total_reserved = total_reserved + ${numberOfRoomsToReserve}
WHERE room_type_id = ${roomTypeId}
AND date between ${startDate} and ${endDate}

Commit
Option 1: Pessimistic locking
Pessimistic locking prevents simultaneous updates by putting a lock on a record while it's being updated.
This can be done in MySQL by using the SELECT... FOR UPDATE query, which locks the rows selected by the query until the transaction is committed.
Redrawn · diagram-design
Pros:
Prevents applications from updating data that is being changed
Easy to implement and avoids conflict by serializing updates. Useful when there is heavy data contention.
Cons:
Deadlocks may occur when multiple resources are locked.
This approach is not scalable - if transaction is locked for too long, this has impact on all other transactions trying to access the resource.
The impact is severe when the query selects a lot of resources and the transaction is long-lived.
The author doesn't recommend this approach due to its scalability issues.
Option 2: Optimistic locking
Optimistic locking allows multiple users to attempt to update a record at the same time.
There are two common ways to implement it - version numbers and timestamps. Version numbers are recommended as server clocks can be inaccurate.
Redrawn · diagram-design
A new version column is added to the database table
Before a user modifies a database row, the version number is read
When the user updates the row, the version number is increased by 1 and written back to the database
Database validation prevents the insert if the new version number doesn't exceed the previous one
Optimistic locking is usually faster than pessimistic locking as we're not locking the database.
Its performance tends to degrade when concurrency is high, however, as that leads to a lot of rollbacks.
Pros:
It prevents applications from editing stale data
We don't need to acquire a lock in the database
Preferred option when data contention is low, ie rarely are there update conflicts
Cons:
Performance is poor when data contention is high
Optimistic locking is a good option for our system as reservation QPS is not extremely high.
Option 3: Database constraints
This approach is very similar to optimistic locking, but the guardrails are implemented using a database constraint:
Similar to optimistic locking, performs poorly when data contention is high
Database constraints cannot be easily version-controlled like application code
Not all databases support constraints
This is another good option for a hotel reservation system due to its ease of implementation.
Scalability
Usually, the load of a hotel reservation system is not high.
However, the interviewer might ask you how you'd handle a situation where the system gets adopted for a larger, popular travel site such as booking.com
In that case, QPS can be 1000 times larger.
When there is such a situation, it is important to understand where our bottlenecks are. All the services are stateless, so they can be easily scaled via replication.
The database, however, is stateful and it's not as obvious how it can get scaled.
One way to scale it is by implementing database sharding - we can split the data across multiple databases, where each of them contain a portion of the data.
We can shard based on hotel_id as all queries filter based on it.
Assuming, QPS is 30,000, after sharding the database in 16 shards, each shard handles 1875 QPS, which is within a single MySQL cluster's load capacity.
Redrawn · diagram-design
We can also utilize caching for room inventory and reservations via Redis. We can set TTL so that old data can expire for days which are past.
Redrawn · diagram-design
The way we store an inventory is based on the hotel_id, room_type_id and date:
key: hotelID_roomTypeID_{date}
value: the number of available rooms for the given hotel ID, room type ID and date.
Data consistency happens async and is managed by using a CDC streaming mechanism - database changes are read and applied to a separate system.
Debezium is a popular option for synchronizing database changes with Redis.
Using such a mechanism, there is a possibility that the cache and database are inconsistent for some time.
This is fine in our case because the database will prevent us from making an invalid reservation.
This will cause some issue on the UI as a user would have to refresh the page to see that "there are no more rooms left",
but that is something which can happen regardless of this issue if eg a person hesitates a lot before making a reservation.
Caching pros:
Reduced database load
High performance, as Redis manages data in-memory
Caching cons:
Maintaining data consistency between cache and DB is hard. We need to consider how the inconsistency impacts user experience.
Data consistency among services
A monolithic application enables us to use a shared relational database for ensuring data consistency.
In our microservice design, we chose a hybrid approach where some services are separate,
but the reservation and inventory APIs are handled by the same servicefor the reservation and inventory APIs.
This is done because we want to leverage the relational database's ACID guarantees to ensure consistency.
However, the interviewer might challenge this approach as it's not a pure microservice architecture, where each service has a dedicated database:
Redrawn · diagram-design
This can lead to consistency issues. In a monolithic server, we can leverage a relational DBs transaction capabilities to implement atomic operations:
Redrawn · diagram-design
It's more challenging, however, to guarantee this atomicity when the operation spans across multiple services:
Redrawn · diagram-design
There are some well-known techniques to handle these data inconsistencies:
Two-phase commit: a database protocol which guarantees atomic transaction commit across multiple nodes.
It's not performant, though, since a single node lag leads to all nodes blocking the operation.
Saga: a sequence of local transactions, where compensating transactions are triggered if any of the steps in a workflow fail. This is an eventually consistent approach.
It's worth noting that addressing data inconsistencies across microservices is a challenging problem, which raise the system complexity.
It is good to consider whether the cost is worth it, given our more pragmatic approach of encapsulating dependent operations within the same relational database.
Step 4: Wrap Up
We presented a design for a hotel reservation system.
These are the steps we went through:
Gathering requirements and doing back-of-the-envelope calculations to understand the system's scale
We presented the API Design, Data Model and system architecture in the high-level design
In the deep dive, we explored alternative database schema designs as requirements changed
We discussed race conditions and proposed solutions - pessimistic/optimistic locking, database constraints
Ways to scale the system via database sharding and caching
Finally we addressed how to handle data consistency issues across multiple microservices
Chapter 23: Distributed Email Service
Introduction
We'll design a distributed email service, similar to Gmail in this chapter.
In 2020, Gmail had 1.8bil active users, while Outlook had 400mil users worldwide.
Step 1: Understand the Problem and Establish Design Scope
C: How many users use the system?
I: 1bil users
C: I think following features are important - auth, send/receive email, fetch email, filter emails, search email, anti-spam protection.
I: Good list. Don't worry about auth for now.
C: How do users connect \w email servers?
I: Typically, email clients connect via SMTP, POP, IMAP, but we'll use HTTP for this problem.
C: Can emails have attachments?
I: Yes
Non-functional requirements
Reliability - we shouldn't lose data
Availability - We should use replication to prevent single points of failure. We should also tolerate partial system failures.
Scalability - As userbase grows, our system should be able to handle them.
Flexibility and extensibility - system should be flexible and easy to extend with new features. One of the reasons we chose HTTP over SMTP/other mail protocols.
Back-of-the-envelope estimation
1bil users
Assuming one person sends 10 emails per day -> 100k emails per second.
Assuming one person receives 40 emails per day and each email on average has 50kb metadata -> 730pb storage per year.
Assuming 20% of emails have storage attachments and average size is 500kb -> 1,460pb per year.
Step 2: Propose High-Level Design and Get Buy-In
Email knowledge 101
There are various protocols used for sending and receiving emails:
SMTP - standard protocol for sending emails from one server to another.
POP - standard protocol for receiving and downloading emails from a remote mail server to a local client. Once retrieved, emails are deleted from remote server.
IMAP - similar to POP, it is used for receiving and downloading emails from a remote server, but it keeps the emails on the server-side.
HTTPS - not technically an email protocol, but it can be used for web-based email clients.
Apart from the mailing protocol, there are some DNS records we need to configure for our email server - the MX records:
Redrawn · diagram-design
Email attachments are sent base64-encoded and there is usually a size limit of 25mb on most mail services.
This is configurable and varies from individual to corporate accounts.
Traditional mail servers
Traditional mail servers work well when there are a limited number of users, connected to a single server.
Redrawn · diagram-design
Alice logs into her Outlook email and presses "send". Email is sent to Outlook mail server. Communication is via SMTP.
Outlook server queries DNS to find MX record for gmail.com and transfers the email to their servers. Communication is via SMTP.
Bob fetches emails from his gmail server via IMAP/POP.
In traditional mail servers, emails were stored on the local file system. Every email was a separate file.
Redrawn · diagram-design
As the scale grew, disk I/O became a bottleneck. Also, it doesn't satisfy our high availability and reliability requirements.
Disks can be damaged and server can go down.
Distributed mail servers
Distributed mail servers are designed to support modern use-cases and solve modern scalability issues.
These servers can still support IMAP/POP for native email clients and SMTP for mail exchange across servers.
But for rich web-based mail clients, a RESTful API over HTTP is typically used.
Example APIs:
POST /v1/messages - sends a message to recipients in To, Cc, Bcc headers.
GET /v1/folders - returns all folders of an email account
Example response:
[{id: string        Unique folder identifier.
  name: string      Name of the folder.
                    According to RFC6154 [9], the default folders can be one of
                    the following: All, Archive, Drafts, Flagged, Junk, Sent,
                    and Trash.
  user_id: string   Reference to the account owner
}]
GET /v1/folders/{:folder_id}/messages - returns all messages under a folder \w pagination
GET /v1/messages/{:message_id} - get all information about a particular message
Example response:
{
  user_id: string                      // Reference to the account owner.
  from: {name: string, email: string}  // <name, email> pair of the sender.
  to: [{name: string, email: string}]  // A list of <name, email> paris
  subject: string                      // Subject of an email
  body: string                         //  Message body
  is_read: boolean                     //  Indicate if a message is read or not.
}
Here's the high-level design of the distributed mail server:
Redrawn · diagram-design
Webmail - users use web browsers to send/receive emails
Web servers - public-facing request/response services used to manage login, signup, user profile, etc.
Real-time servers - Used for pushing new email updates to clients in real-time. We use websockets for real-time communication but fallback to long-polling for older browsers that don't support them.
Metadata db - stores email metadata such as subject, body, from, to, etc.
Attachment store - Object store (eg Amazon S3), suitable for storing large files.
Distributed cache - We can cache recent emails in Redis to improve UX.
Search store - distributed document store, used for supporting full-text searches.
Here's what the email sending flow looks like:
Redrawn · diagram-design
User writes an email and presses "send". Email is sent to load balancer.
Load balancer rate limits excessive mail sends and routes to one of the web servers.
Web servers do basic email validation (eg email size) and short-circuits outbound flow if domain is same as sender. But does spam check first.
If basic validation passes, email is sent to message queue (attachment is referenced from object store)
If basic validation fails, email is sent to error queue
SMTP outgoing workers pull messages from outgoing queue, do spam/virus checks and route to destination mail server.
Email is stored in the "Sent Emails" folder
We need to also monitor size of outgoing message queue. Growing too large might indicate a problem:
Recipient's mail server is unavailable. We can retry sending the email at a later time using exponential backoff.
Not enough consumers to handle the load, we might have to scale the consumers.
Here's the email receiving flow:
Redrawn · diagram-design
Incoming emails arrive at the SMTP load balancer. Mails are distributed to SMTP servers, where mail acceptance policy is done (eg invalid emails are directly discarded).
If attachment of email is too large, we can put it in object store (s3).
Mail processing workers do preliminary checks, after which mails are forwarded to storage, cache, object store and real-time servers.
Offline users get their new emails once they come back online via HTTP API.
Step 3: Design Deep Dive
Let's now go deeper into some of the components.
Metadata database
Here are some of the characteristics of email metadata:
headers are usually small and frequently accessed
Body size ranges from small to big, but is typically read once
Most mail operations are isolated to a single user - eg fetching email, marking as read, searching.
Data recency impacts data usage. Users typically read only recent emails
Data has high-reliability requirements. Data loss is unacceptable.
At gmail/outlook scale, the database is typically custom made to reduce input/output operations per second (IOPS).
Let's consider what database options we have:
Relational database - we can build indexes for headers and body, but these DBs are typically optimized for small chunks of data.
Distributed object store - this can be a good option for backup storage, but can't efficiently support searching/marking as read/etc.
NoSQL - Google BigTable is used by gmail, but it's not open-sourced.
Based on above analysis, very few existing solutions seems to fit our needs perfectly.
In an interview setting, it's infeasible to design a new distributed database solution, but important to mention characteristics:
Single column can be a single-digit MB
Strong data consistency
Designed to reduce disk I/O
Highly available and fault tolerant
Should be easy to create incremental backups
In order to partition the data, we can use the user_id as a partition key, so that one user's data is stored on a single shard.
This prohibits us from sharing an email with multiple users, but this is not a requirement for this interview.
Let's define the tables:
Primary key consists of partition key (data distribution) and clustering key (sorting data)
Queries we need to support - get all folders for a user, display all emails for a folder, create/get/delete an email, fetch read/unread email, get conversation threads (bonus)
Legend for tables to follow:
Redrawn · diagram-design
Here is the folders table:
Redrawn · diagram-design
emails table:
Redrawn · diagram-design
email_id is timeuuid which allows sorting based on timestamp when email was created
Attachments are stored in a separate table, identified by filename:
Redrawn · diagram-design
Supporting fetchin read/unread emails is easy in a traditional relational database, but not in Cassandra, since filtering on non-partition/clustering key is prohibited.
One workaround to fetch all emails in a folder and filter in-memory, but that doesn't work well for a big-enough application.
What we can do is denormalize the emails table into read/unread emails tables:
Redrawn · diagram-design
In order to support conversation threads, we can include some headers, which mail clients interpret and use to reconstruct a conversation thread:
Finally, we'll trade availability for consistency for our distributed database, since it is a hard requirement for this problem.
Hence, in the event of a failover or network parititon, sync/update actions will be briefly unavailable to impacted users.
Email deliverability
It is easy to setup a server to send emails, but getting the email to a receiver's inbox is hard, due to spam-protection algorithms.
If we just setup a new mail server and start sending mails through it, our emails will probably end up in the spam folder.
Here's what we can do to prevent that:
Dedicated IPs - use dedicated IPs for sending emails, otherwise, recipient servers will not trust you.
Classify emails - avoid sending marketing emails from the same servers to prevent more important email to be classified as spam
Warm up your IP address slowly to build a good reputation with big email providers. It takes 2 to 6 weeks to warm up a new IP
Ban spammers quickly to not deteriorate your reputation
Feedback processing - setup a feedback loop with ISPs to keep track of complaint rate and ban spam accounts quickly.
Email authentication - use common techniques to combat phishing such as Sender Policy Framework, DomainKeys Identified Mail, etc.
You don't need to remember all of this. Just know that building a good mail server requires a lot of domain knowledge.
Search
Searching includes doing a full-text search based on email contents or more advanced queries based on from, to, subject, unread, etc filters.
One characteristic of email search is that it is local to the user and it has more writes than reads, because we need to re-index it on each operation, but users rarely use the search tab.
Let's compare google search with email search:
Scope
Sorting
Accuracy
Google search
The whole internet
Sort by relevance
Indexing takes some time, so not instant results.
Email search
User's own email box
Sort by attributes eg time, date, etc
Indexing should be quick and results accurate.
To achieve this search functionality, one option is to use an Elasticsearch cluster. We can use user_id as the partition key to group data under the same node:
Redrawn · diagram-design
Mutating operations are async via Kafka in order to decouple services from the reindexing flow.
Actually searching for data happens synchronously.
Elasticsearch is one of the most popular search-engine databases and supports full-text search for emails very well.
Alternatively, we can attempt to develop our own custom search solution to meet our specific requirements.
Designing such a system is out of scope. One of the core challenges when building it is to optimize it for write-heavy workloads.
To achieve that, we can use Log-Structured Merge-Trees (LSM) to structure the index data on disk. Write path is optimized for sequential writes only.
This technique is used in Cassandra, BigTable and RocksDB.
Its core idea is to store data in-memory until a predefined threshold is reached, after which it is merged in the next layer (disk):
Redrawn · diagram-design
Main trade-offs between the two approaches:
Elasticsearch scales to some extent, whereas a custom search engine can be fine-tuned for the email use-case, allowing it to scale further.
Elasticsearch is a separate service we need to maintain, alongside the metadata store. A custom solution can be the datastore itself.
Elasticsearch is an off-the-shelf solution, whereas the custom search engine would require significant engineering effort to build.
Scalability and availability
Since individual user operations don't collide with other users, most components can be independently scaled.
To ensure high availability, we can also use a multi-DC setup with leader-folower failover in case of failures:
Redrawn · diagram-design
Step 4: Wrap Up
Additional talking points:
Fault tolerance - Many parts of the system could fail. It is worthwhile how we'd handle node failures.
Compliance - PII needs to be stored in a reasonable way, given Europe's GDPR laws.
Security - email encryption, phishing protection, safe browsing, etc.
Optimizations - eg preventing duplication of the same attachments, sent multiple times by different users.
Chapter 24: S3-like Object Storage
Introduction
In this chapter, we'll be designing an object storage service, similar to Amazon S3.
Storage systems fall into three broad categories:
Block storage
File storage
Object storage
Block storage are devices, which came out in 1960s. HDDs and SSDs are such examples.
These devices are typically physically attached to a server, although they can also be network-attached via high-speed network protocols.
Servers can format the raw blocks and use them as a file system or it can hand control of them to servers directly.
File storage is built on top of block storage. It provides a higher level of abstraction, making it easier to manage folders and files.
Object storage sacrifices performance for high durability, vast scale and low cost.
It targets "cold" data and is mainly used for archival and backup.
There is no hierarchical directory structure, all data is stored as objects in a flat structure.
It is relatively slow compared to other storage types. Most cloud providers have an object storage offering - Amazon S3, Google GCS, etc.
Redrawn · diagram-design
Block Storage
File Storage
Object Storage
Mutable Content
Y
Y
N (has object versioning)
Cost
High
Medium to high
Low
Performance
Medium to high, very high
Medium to high
Low to medium
Consistency
Strong consistency
Strong consistency
Strong consistency [5]
Data access
SAS/iSCSI/FC
Standard file access, CIFS/SMB, and NFS
RESTful API
Scalability
Medium scalability
High scalability
Vast scalability
Good for
Virtual machines (VM), databases
General-purpose file system access
Binary data, unstructured data
Some terminology, related to object storage:
Bucket - logical container for objects. Name is globally unique.
Object - An individual piece of data, stored in a bucket. Contains object data and metadata.
Versioning - A feature keeping multiple variants of an object in the same bucket.
Uniform Resource Identifier (URI) - each resource is uniquely identified by a URI.
Service-level Agreement (SLA) - contract between service provider and client.
Amazon S3 Standard-Infrequent Access storage class SLAs:
Durability of 99.999999999% across multiple Availability Zones
Data is resilient in the event of entire Availability Zone being destroyed
Designed for 99.9% availability
Step 1: Understand the Problem and Establish Design Scope
C: Which features should be included?
I: Bucket creation, Object upload/download, versioning, Listing objects in a bucket
C: What is the typical data size?
I: We need to store both massive objects and small objects efficiently
C: How much data do we store in a year?
I: 100 petabytes
C: Can we assume 6 nines of data durbility (99.9999%) and service availability of 4 nines (99.99%)?
I: Yes, sounds reasonable
Non-functional requirements
100 PB of data
6 nines of data durability
4 nines of service availability
Storage efficiency. Reduce storage cost while maintaining high reliability and performance
Back-of-the-envelope estimation
Object storage is likely to have bottlenecks in disk capacity or IO per second (IOPS).
Assumptions:
we have 20% small (less than 1mb), 60% mid-size (1-64mb) and 20% large objects (greater than 64mb),
One hard disk (SATA, 7200rpm) is capable of doing 100-150 random seeks per second (100-150 IOPS)
Given the assumptions, we can estimate the total number of objects the system can persist.
Let's use median size per object type to simplify calculation - 0.5mb for small, 32mb for medium, 200mb for large.
Given 100PB of storage (10^11 MB) and 40% of storage usage results in 0.68bil objects
If we assume metadata is 1kb, then we need 0.68tb space to store metadata info
Step 2: Propose High-Level Design and Get Buy-In
Let's explore some interesting properties of object storage before diving into the design:
Object immutability - objects in object storage are immutable (not the case in other storage systems). We may delete them or replace them, but no update.
Key-value store - an object URI is its key and we can get its contents by making an HTTP call
Write once, read many times - data access pattern is writing once and reading many times. According to some Linkedin research, 95% of operations are reads
Support both small and large objects
Design philosophy of object storage is similar to UNIX - when we save a file, it creates the filename in a data structure, called inode and file data is stored in different disk locations.
The inode contains a list of file block pointers, which point to different locations on disk.
When accessing a file, we first fetch its metadata from the inode, prior to fetching the file contents.
Object storage works similarly - metadata store is used for file information, but contents are stored on disk:
Redrawn · diagram-design
By separating metadata from file contents, we can scale the different stores independently:
Redrawn · diagram-design
High-level design
Redrawn · diagram-design
Load balancer - distributes API requests across service replicas
API service - Stateless server, orchestrating calls to metadata and object store, as well as IAM service.
Identity and access management (IAM) - central place for auth, authz, access control.
Data store - stores and retrieves actual data. Operations are based on object ID (UUID).
Metadata store - stores object metadata
Uploading an object
Redrawn · diagram-design
Create a bucket named "bucket-to-share" via HTTP PUT request
API service calls IAM to ensure user is authorized and has write permissions
API service calls metadata store to create a bucket entry. Once created, success response is returned.
After bucket is created, HTTP PUT is sent to create an object named "script.txt"
API service verifies user identity and ensures user has write permissions
Once validation passes, object payload is sent via HTTP PUT to the data store. Data store persists it and returns a UUID.
API service calls metadata store to create a new entry with object_id, bucket_id and bucket_name, among other metadata.
Example object upload request:
PUT /bucket-to-share/script.txt HTTP/1.1
Host: foo.s3example.org
Date: Sun, 12 Sept 2021 17:51:00 GMT
Authorization: authorization string
Content-Type: text/plain
Content-Length: 4567
x-amz-meta-author: Alex

[4567 bytes of object data]
Downloading an object
Buckets have no directory hierarchy, buy we can create a logical hierarchy by concatenating bucket name and object name to simulate a folder structure.
Client sends an HTTP GET request to the load balancer, ie GET /bucket-to-share/script.txt
API service queries IAM to verify the user has correct permissions to read the bucket
Once validated, UUID of object is retrieved from metadata store
Object payload is retrieved from data store based on UUID and returned to the client
// sprint 1
Step 3: Design Deep Dive
Data store
Here's how the API service interacts with the data store:
Redrawn · diagram-design
The data store's main components:
Redrawn · diagram-design
The data routing service provides a RESTful or gRPC API to access the data node cluster.
It is a stateless service, which scales by adding more servers.
It's main responsibilities are:
querying the placement service to get the best data node to store data
reading data from data nodes and returning it to the API service
Writing data to data nodes
The placement service determines which data nodes should store an object.
It maintains a virtual cluster map, which determines the physical topology of a cluster.
Redrawn · diagram-design
The service also sends heartbeats to all data nodes to determine if they should be removed from the virtual cluster.
Since this is a critical service, it is recommended to maintain a cluster of 5 or 7 replicas, synchronized via Paxos or Raft consensus algorithms.
Eg a 7 node cluster can tolerate 3 nodes failing.
Data nodes store the actual object data.
Reliability and durability is ensured by replicating data to multiple data nodes.
Each data node has a daemon running, which sends heartbeats to the placement service.
The heartbeat includes:
How many disk drives (HDD or SSD) does the data node manage?
How much data is stored on each drive?
Data persistence flow
Redrawn · diagram-design
API service forwards the object data to data store
Data routing service sends the data to the primary data node
Primary data node saves the data locally and replicates it to two secondary data nodes. Response is sent after successful replication.
The UUID of the object is returned to the API service.
Caveats:
Given an object UUID, it's replication group is deterministically chosen by using consistent hashing
In step 4, the primary data node replicates the object data before returning a response. This favors strong consistency over higher latency.
Redrawn · diagram-design
How data is organized
One simple approach to managing data is to store each object in a separate file.
This works, but is not performant with many small files in a file system:
Data blocks on HDD are wasted, because every file uses the whole block size. Typical block size is 4kb.
Many files means many inodes. Operating systems don't deal well with too many inodes and there is also a max inode limit.
These issues can be addressed by merging many small files into bigger ones via a write-ahead log (WAL). Once the file reaches its capacity (typically a few GB), a new file is created:
Redrawn · diagram-design
The downside of this approach is that write access to the file needs to be serialized. Multiple cores accessing the same file must wait for each other.
To fix this, we can confine files to specific cores to avoid lock contention.
Object lookup
To support storing multiple objects in the same file, we need to maintain a table, which tells the data node:
object_id
filename where object is stored
file_offset where object starts
object_size
We can deploy this table in a file-based db like RocksDB or a traditional relational database.
Since the access pattern is low write+high read, a relational database works better.
How should we deploy it?
We could deploy the db and scale it separately in a cluster, accessed by all data nodes.
Downsides:
we'd need to aggressively scale the cluster to serve all requests
there's additional network latency between data node and db cluster
An alternative is to take advantage of the fact that data nodes are only interested to data related to them,
so we can deploy the relational db within the data node itself.
SQLite is a good option as it's a lightweight file-based relational database.
Updated data persistence flow
Redrawn · diagram-design
API Service sends a request to save a new object
Data node service appends the new object at the end of a file, named "/data/c"
A new record for the object is inserted into the object mapping table
Durability
Data durability is an important requirement in our design. In order to achieve 6 nines of durability, every failure case needs to be properly examined.
First problem to address is hardware failures. We can achieve that by replicating data nodes to minimize probability of failure.
But in addition to that, we also ought to replicate across different failure domains (cross-rack, cross-dc, separate networks, etc).
A critical event can cause multiple hardware failures within the same domain:
Redrawn · diagram-design
Assuming annual failure rate of a typical HDD is 0.81%, making three copies gives us 6 nines of durability.
Replicating the data nodes like that grants us the durability we want, but we could also leverage erasure coding to reduce storage costs.
Erasure coding enables us to use parity bits, which allow us to reconstruct lost bits in the event of a failure:
Redrawn · diagram-design
Imagine those bits are data nodes. If two of them go down, they can be recovered using the remaining four ones.
There are different erasure coding schemes. In our case, we could use 8+4 erasure coding, split across different failure domains to maximize reliability:
Redrawn · diagram-design
Erasure coding enables us to achieve a much lower storage cost (50% improvement) at the expense of access speed due to the data routing service having to collect data from multiple locations:
Redrawn · diagram-design
Other caveats:
Replication requires 200% storage overhead (in case of 3 replicas) vs. 50% via erasure coding
Erasure coding requires more computation to calculate and store parities
In sum, replication is more useful for latency-sensitive applications, whereas erasure coding is attractive for storage cost efficiency and durability.
Erasure coding is also much harder to implement.
Correctness verification
If a disk fails entirely, then the failure is easy to detect. This is less straightforward in the event part of the disk memory gets corrupted.
To detect this, we can use checksums - a hash of the file contents, which can be used to verify the file's integrity.
In our case, we'll store checksums for each file and each object:
Redrawn · diagram-design
In the case of erasure coding (8+4), we'll need to fetch each of the 8 pieces of data separately and verify each of their checksums.
// sprint 2
Metadata data model
Table schemas:
Redrawn · diagram-design
Queries we need to support:
Find an object ID by name
Insert/delete object based on name
List objects in a bucket sharing the same prefix
There is usually a limit on the number of buckets a user can create, hence, the size of the buckets table is small and can fit into a single db server.
But we still need to scale the server for read throughput.
The object table will probably not fit into a single database server, though. Hence, we can scale the table via sharding:
Sharding by bucket_id will lead to hotspot issues as a bucket can have billions of objects
Sharding by bucket_id makes the load more evenly distributed, but our queries will be slow
We choose sharding by hash(bucket_name, object_name) since most queries are based on the object/bucket name.
Even with this sharding scheme, though, listing objects in a bucket will be slow.
Listing objects in a bucket
In a single database, listing an object based on its prefix (looks like a directory) works like this:
SELECT * FROM object WHERE bucket_id = "123" AND object_name LIKE `abc/%`
This is challenging to fulfill when the database is sharded. To achieve it, we can run the query on every shard and aggregate the results in-memory.
This makes pagination challenging though, since different shards contain a different result size and we need to maintain separate limit/offset for each.
We can leverage the fact that typically object stores are not optimized for listing objects, so we can sacrifice listing performance.
We can also create a denormalized table for listing objects, sharded by bucket ID.
That would make our listing query sufficiently fast as it's isolated to a single database instance.
Object versioning
Versioning works by having another object_version column which is of type TIMEUUID, enabling us to sort records based on it.
Each new version produces a new object_id:
Redrawn · diagram-design
Deleting an object creates a new version with a special object_id indicating that the object was deleted. Queries for it return 404:
Redrawn · diagram-design
Optimizing uploads of large files
Uploading large files can be optimized by using multipart uploads - splitting a big file into several chunks, uploaded independently:
Redrawn · diagram-design
Client calls service to initiate a multipart upload
Data store returns an upload ID which uniquely identifies the upload
Client splits the large file into several chunks, uploaded independently using the upload id
When a chunk is uploaded, the data store returns an etag, which is a md5 checksum, identifying that upload chunk
After all parts are uploaded, client sends a complete multipart upload request, which includes upload_id, part numbers and all etags
Data store reassembles the object from its parts. The process can take a few minutes. After that, success response is returned to the client.
Old parts, which are no longer useful can be removed at this point. We can introduce a garbage collector to deal with it.
Garbage collection
Garbage collection is the process of reclaiming storage space, which is no longer used. There are a few ways data becomes garbage:
lazy object deletion - object is marked as deleted without actually getting deleted
orphan data - eg an upload failed mid-flight and old parts need to be deleted
corrupted data - data which failed checksum verification
The garbage collector is also responsible for reclaiming unused space in replicas.
With replication, data is deleted from both primaries and replicas. With erasure coding (8+4), data is deleted from all 12 nodes.
To facilitate the deletion, we'll use a process called compaction:
Garbage collector copies objects which are not deleted from "data/b" to "data/d"
object_mapping table is updated once copying is complete using a database transaction
To avoid making too many small files, compaction is done on files which grow beyond a certain threshold
Redrawn · diagram-design
Step 4: Wrap Up
Things we covered:
Designing an S3-like object storage
Comparing differences between object, block and file storages
Covered uploading, downloading, listing, versioning of objects in a bucket
Deep dived in the design - data store and metadata store, replication and erasure coding, multipart uploads, sharding
Chapter 25: Real-time Gaming Leaderboard
Introduction
We are going to design a leaderboard for an online mobile game:
Redrawn · diagram-design
Step 1: Understand the Problem and Establish Design Scope
C: How is the score calculated for the leaderboard?
I: User gets a point whenever they win a match.
C: Are all players included in the leaderboard?
I: Yes
C: Is there a time segment, associated with the leaderboard?
I: Each month, a new tournament starts which starts a new leaderboard.
C: Can we assume we only care about top 10 users?
I: We want to display top 10 users, along with position of specific user. If time permits, we can discuss showing users around particular user in the leaderboard.
C: How many users are in a tournament?
I: 5mil DAU and 25mil MAU
C: How many matches are played on average during a tournament?
I: Each player plays 10 matches per day on average
C: How do we determine the rank if two players have the same score?
I: Their rank is the same in that case. If time permits, we can discuss breaking ties.
C: Does the leaderboard need to be real-time?
I: Yes, we want to present real-time results or as close as possible to real-time. It is not okay to present batched result history.
Functional requirements
Display top 10 players on leaderboard
Show a user's specific rank
Display users which are four places above and below given user (bonus)
Non-functional requirements
Real-time updates on scores
Score update is reflected on the leaderboard in real-time
General scalability, availability, reliability
Back-of-the-envelope estimation
With 50mil DAU, if the game has an even distribution of players during a 24h period, we'd have an average of 50 users per second.
However, since distribution is typically uneven, we can estimate that the peak online users would be 250 users per second.
QPS for users scoring a point - given 10 games per day on average, 50 users/s * 10 = 500 QPS. Peak QPS = 2500.
QPS for fetching the top 10 leaderboard - assuming users open that once a day on average, QPS is 50.
Step 2: Propose High-Level Design and Get Buy-In
API Design
The first API we need is one to update a user's score:
POST /v1/scores
This API takes two params - user_id and points scored for winning a game.
This API should only be accessible to game servers, not end clients.
Next one is for getting the top 10 players of the leaderboard:
When a player wins a game, client sends a request to the game service
Game service validates if win is valid and calls the leaderboard service to update the player's score
Leaderboard service updates the user's score in the leaderboard store
Player makes a call to leaderboard service to fetch leaderboard data, eg top 10 players and given player's rank
An alternative design which was considered is the client updating their score directly within the leaderboard service:
Redrawn · diagram-design
This option is not secure as it's susceptible to man-in-the-middle attacks. Players can put a proxy and change their score as they please.
One additional caveat is that for games, where the game logic is managed by the server, cliets don't need to call the server explicitly to record their win.
Servers do it automatically for them based on the game logic.
One additional consideration is whether we should put a message queue between the game server and the leaderboard service. This would be useful if other services are interested in game results, but that is not an explicit requirement in the interview so far, hence it's not included in the design:
Redrawn · diagram-design
Data models
Let's discuss the options we have for storing leaderboard data - relational DBs, Redis, NoSQL.
The NoSQL solution is discussed in the deep dive section.
Relational database solution
If the scale doesn't matter and we don't have that many users, a relational DB serves our quite well.
We can start from a simple leaderboard table, one for each month (personal note - this doesn't make sense. You can just add a month column and avoid the headache of maintaining new tables each month):
Redrawn · diagram-design
There is additional data to include in there, but that is irrelevant to the queries we'd run, so it's omitted.
What happens when a user wins a point?
Redrawn · diagram-design
If a user doesn't exist in the table yet, we need to insert them first:
INSERT INTO leaderboard (user_id, score) VALUES ('mary1934', 1);
On subsequent calls, we'd just update their score:
UPDATE leaderboard set score=score + 1 where user_id='mary1934';
How do we find the top players of a leaderboard?
Redrawn · diagram-design
We can run the following query:
SELECT (@rownum := @rownum + 1) AS rank, user_id, score
FROM leaderboard
ORDER BY score DESC;
This is not performant though as it makes a table scan to order all records in the database table.
We can optimize it by adding an index on score and using the LIMIT operation to avoid scanning everything:
SELECT (@rownum := @rownum + 1) AS rank, user_id, score
FROM leaderboard
ORDER BY score DESC
LIMIT 10;
This approach, however, doesn't scale well if the user is not at the top of the leaderboard and you'd want to locate their rank.
Redis solution
We want to find a solution, which works well even for millions of players without having to fallback on complex database queries.
Redis is an in-memory data store, which is fast as it works in-memory and has a suitable data structure to serve our needs - sorted set.
A sorted set is a data structure similar to sets in programming languages, which allows you to keep a data structure sorted by a given criteria.
Internally, it is implemented using a hash-map to maintain mapping between key (user_id) and value (score) and a skip list which maps scores to users in sorted order:
Redrawn · diagram-design
How does a skip list work?
It is a linked list which allows for fast search
It consists of a sorted linked list and multi-level indexes
Redrawn · diagram-design
This structure enables us to quickly search for specific values when the data set is large enough.
In the example below (64 nodes), it requires traversing 62 nodes in a base linked list to find the given value and 11 nodes in the skip-list case:
Redrawn · diagram-design
Sorted sets are more performant than relational databases as the data is kept sorted at all times at the price of O(logN) add and find operation.
In contract, here's an example nested query we need to run to find the rank of a given user in a relational DB:
SELECT *,(SELECT COUNT(*) FROM leaderboard lb2
WHERE lb2.score >= lb1.score) RANK
FROM leaderboard lb1
WHERE lb1.user_id = {:user_id};
What operations do we need to operate our leaderboard in Redis?
ZADD - insert the user into the set if they don't exist. Otherwise, update the score. O(logN) time complexity.
ZINCRBY - increment the score of a user by given amount. If user doesn't exist, score starts at zero. O(logN) time complexity.
ZRANGE/ZREVRANGE - fetch a range of users, sorted by their score. We can specify order (ASC/DESC), offset and result size. O(logN+M) time complexity where M is result size.
ZRANK/ZREVRANK - Fetch the position (rank) of given user in ASC/DESC order. O(logN) time complexity.
What happens when a user scores a point?
ZINCRBY leaderboard_feb_2021 1 'mary1934'
There's a new leaderboard created every month while old ones are moved to historical storage.
What happens when a user fetches top 10 players?
ZREVRANGE leaderboard_feb_2021 0 9 WITHSCORES
Example result:
[(user2,score2),(user1,score1),(user5,score5)...]
What about user fetching their leaderboard position?
Redrawn · diagram-design
This can be easily achieved by the following query, given that we know a user's leaderboard position:
ZREVRANGE leaderboard_feb_2021 357 365
A user's position can be fetched using ZREVRANK <user-id>.
Let's explore what our storage requirements are:
Assuming worst-case scenario of all 25mil MAU participating in the game for a given month
ID is 24-character string and score is 16-bit integer, we need 26 bytes * 25mil = ~650MB of storage
Even if we double the storage cost due to the overhead of the skip list, this would still easily fit in a modern redis cluster
Another non-functional requirement to consider is supporting 2500 updates per second. This is well within a single Redis server's capabilities.
Additional caveats:
We can spin up a Redis replica to avoid losing data when a redis server crashes
We can still leverage Redis persistence to not lose data in the event of a crash
We'll need two supporting tables in MySQL to fetch user details such as username, display name, etc as well as store when eg a user won a game
The second table in MySQL can be used to reconstruct leaderboard when there is an infrastructure failure
As a small performance optimization, we could cache the user details of top 10 players as they'd be frequently accessed
Step 3: Design Deep Dive
To use a cloud provider or not
We can either choose to deploy and manage our own services or use a cloud provider to manage them for us.
If we choose to manage the services our selves, we'll use redis for leaderboard data, mysql for user profile and potentially a cache for user profile if we want to scale the database:
Redrawn · diagram-design
Alternatively, we could use cloud offerings to manage a lot of the services for us. For example, we can use AWS API Gateway to route API calls to AWS Lambda functions:
Redrawn · diagram-design
AWS Lambda enables us to run code without managing or provisioning servers ourselves. It runs only when needed and scales automatically.
Exmaple user scoring a point:
Redrawn · diagram-design
Example user retrieving leaderboard:
Redrawn · diagram-design
Lambdas are an implementation of a serverless architecture. We don't need to manage scaling and environment setup.
Author recommends going with this approach if we build the game from the ground up.
Scaling Redis
With 5mil DAU, we can get away with a single Redis instance from both a storage and QPS perspective.
However, if we imagine userbase grows 10x to 500mil DAU, then we'd need 65gb for storage and QPS goes to 250k.
Such scale would require sharding.
One way to achieve it is by range-partitioning the data:
Redrawn · diagram-design
In this example, we'll shard based on user's score. We'll maintain the mapping between user_id and shard in application code.
We can do that either via MySQL or another cache for the mapping itself.
To fetch the top 10 players, we'd query the shard with the highest scores ([900-1000]).
To fetch a user's rank, we'll need to calculate the rank within the user's shard and add up all users with higher scores in other shards.
The latter is a O(1) operation as total records per shard can quickly be accessed via the info keyspace command.
Alternatively, we can use hash partitioning via Redis Cluster. It is a proxy which distributes data across redis nodes based on partitioning similar to consistent hashing, but not exactly the same:
Redrawn · diagram-design
Calculating the top 10 players is challenging with this setup. We'll need to get the top 10 players of each shard and merge the results in the application:
Redrawn · diagram-design
There are some limitations with the hash partitioning:
If we need to fetch top K users, where K is high, latency can increase as we'll need to fetch a lot of data from all the shards
Latency increases as the number of partitions grows
There is no straightforward approach to determine a user's rank
Due to all this, the author leans towards using fixed partitions for this problem.
Other caveats:
A best practice is to allocate twice as much memory as required for write-heavy redis nodes to accommodate snapshots if required
We can use a tool called Redis-benchmark to track the performance of a redis setup and make data-driven decisions
Alternative solution: NoSQL
An alternative solution to consider is using an appropriate NoSQL database optimized for:
heavy writes
effectively sorting items within the same partition by score
DynamoDB, Cassandra or MongoDB are all good fits.
In this chapter, the author has decided to use DynamoDB. It is a fully-managed NoSQL database, which offers reliable performance and great scalability.
It also enables usage of global secondary indexes when we need to query fields not part of the primary key.
Redrawn · diagram-design
Let's start from a table for storing a leaderboard for a chess game:
Redrawn · diagram-design
This works well, but doesn't scale well if we need to query anything by score. Hence, we can put the score as a sort key:
Redrawn · diagram-design
Another problem with this design is that we're partitioning by month. This leads to a hotspot partition as the latest month will be unevenly accessed compared to the others.
We could use a technique called write sharding, where we append a partition number for each key, calculated via user_id % num_partitions:
Redrawn · diagram-design
An important trade-off to consider is how many partitions we should use:
The more partitions there are, the higher the write scalability
However, read scalability suffers as we need to query more partitions to collect aggregate results
Using this approach requires that we use the "scatter-gather" technique we saw earlier, which grows in time complexity as we add more partitions:
Redrawn · diagram-design
To make a good evaluation on the number of partitions, we'd need to do some benchmarking.
This NoSQL approach still has one major downside - it is hard to calculate the specific rank of a user.
If we have sufficient scale to require us to shard, we could then perhaps tell users what "percentile" of scores they're in.
A cron job can periodically run to analyze score distributions, based on which a user's percentile is determined, eg:
Faster retrieval - We can cache the user object via a Redis hash with mapping user_id -> user object. This enables faster retrieval vs. querying the database.
Breaking ties - When two players have the same score, we can break the tie by sorting them based on last played game.
System failure recovery - In the event of a large-scale Redis outage, we can recreate the leaderboard by going through the MySQL WAL entries and recreate it via an ad-hoc script
Chapter 26: Payment System
Introduction
We'll design a payment system in this chapter, which underpins all of modern e-commerce.
A payment system is used to settle financial transactions, transferring monetary value.
Step 1: Understand the Problem and Establish Design Scope
C: What kind of payment system are we building?
I: A payment backend for an e-commerce system, similar to Amazon.com. It handles everything related to money movement.
C: What payment options are supported - Credit cards, PayPal, bank cards, etc?
I: The system should support all these options in real life. For the purposes of the interview, we can use credit card payments.
C: Do we handle credit card processing ourselves?
I: No, we use a third-party provider like Stripe, Braintree, Square, etc.
C: Do we store credit card data in our system?
I: Due to compliance reasons, we do not store credit card data directly in our systems. We rely on third-party payment processors.
C: Is the application global? Do we need to support different currencies and international payments?
I: The application is global, but we assume only one currency is used for the purposes of the interview.
C: How many payment transactions per day do we support?
I: 1mil transactions per day.
C: Do we need to support the payout flow to eg payout to payers each month?
I: Yes, we need to support that
C: Is there anything else I should pay attention to?
I: We need to support reconciliations to fix any inconsistencies in communicating with internal and external systems.
Functional requirements
Pay-in flow - payment system receives money from customers on behalf of merchants
Pay-out flow - payment system sends money to sellers around the world
Non-functional requirements
Reliability and fault-tolerance. Failed payments need to be carefully handled
A reconciliation between internal and external systems needs to be setup.
Back-of-the-envelope estimation
The system needs to process 1mil transactions per day, which is 10 transactions per second.
This is not a high throughput for any database system, so it's not the focus of this interview.
Step 2: Propose High-Level Design and Get Buy-In
At a high-level, we have three actors, participating in money movement:
Redrawn · diagram-design
Pay-in flow
Here's the high-level overview of the pay-in flow:
Redrawn · diagram-design
Payment service - accepts payment events and coordinates the payment process. It typically also does a risk check using a third-party provider for AML violations or criminal activity.
Payment executor - executes a single payment order via the Payment Service Provider (PSP). Payment events may contain several payment orders.
Payment service provider (PSP) - moves money from one account to another, eg from buyer's credit card account to e-commerce site's bank account.
Card schemes - organizations that process credit card operations, eg Visa MasterCard, etc.
Ledger - keeps financial record of all payment transactions.
Wallet - keeps the account balance for all merchants.
Here's an example pay-in flow:
user clicks "place order" and a payment event is sent to the payment service
payment service stores the event in its database
payment service calls the payment executor for all payment orders, part of that payment event
payment executor stores the payment order in its database
payment executor calls external PSP to process the credit card payment
After the payment executor processes the payment, the payment service updates the wallet to record how much money the seller has
wallet service stores updated balance information in its database
payment service calls the ledger to record all money movements
there are many payment orders, linked to a given payment event
we don't need the seller_info for the pay-in flow. That's required on pay-out only
ledger_updated and wallet_updated are updated when the respective service is called to record the result of a payment
payment transitions are managed by a background job, which checks updates of in-flight payments and triggers an alert if a payment is not processed in a reasonable timeframe
Double-entry ledger system
The double-entry accounting mechanism is key to any payment system. It is a mechanism of tracking money movements by always applying money operations to two accounts, where one's account balance increases (credit) and the other decreases (debit):
Account
Debit
Credit
buyer
$1
seller
$1
Sum of all transaction entries is always zero. This mechanism provides end-to-end traceability of all money movements within the system.
Hosted payment page
To avoid storing credit card information and having to comply with various heavy regulations, most companies prefer utilizing a widget, provided by PSPs, which store and handle credit card payments for you:
Redrawn · diagram-design
Pay-out flow
The components of the pay-out flow are very similar to the pay-in flow.
Main differences:
money is moved from e-commerce site's bank account to merchant's bank account
we can utilize a third-party account payable provider such as Tipalti
There's a lot of bookkeeping and regulatory requirements to handle with regards to pay-outs as well
Step 3: Design Deep Dive
This section focuses on making the system faster, more robust and secure.
PSP Integration
If our system can directly connect to banks or card schemes, payment can be made without a PSP.
These kinds of connections are very rare and uncommon, typically done at large companies which can justify the investment.
If we go down the traditional route, a PSP can be integrated in one of two ways:
Through API, if our payment system can collect payment information
Through a hosted payment page to avoid dealing with payment information regulations
Here's how the hosted payment page workflow works:
Redrawn · diagram-design
User clicks "checkout" button in the browser
Client calls the payment service with the payment order information
After receiving payment order information, the payment service sends a payment registration request to the PSP.
The PSP receives payment info such as currency, amount, expiration, etc, as well as a UUID for idempotency purposes. Typically the UUID of the payment order.
The PSP returns a token back which uniquely identifies the payment registration. The token is stored in the payment service database.
Once token is stored, the user is served with a PSP-hosted payment page. It is initialized using the token as well as a redirect URL for success/failure.
User fills in payment details on the PSP page, PSP processes payment and returns the payment status
User is now redirected back to the redirectURL. Example redirect url - https://your-company.com/?tokenID=JIOUIQ123NSF&payResult=X324FSa
Asynchronously, the PSP calls our payment service via a webhook to inform our backend of the payment result
Payment service records the payment result based on the webhook received
Reconciliation
The previous section explains the happy path of a payment. Unhappy paths are detected and reconciled using a background reconciliation process.
Every night, the PSP sends a settlement file which our system uses to compare the external system's state against our internal system's state.
Redrawn · diagram-design
This process can also be used to detect internal inconsistencies between eg the ledger and the wallet services.
Mismatches are handled manually by the finance team. Mismatches are handled as:
classifiable, hence, it is a known mismatch which can be adjusted using a standard procedure
classifiable, but can't be automated. Manually adjusted by the finance team
unclassifiable. Manually investigated and adjusted by the finance team
Handling payment processing delays
There are cases, where a payment can take hours to complete, although it typically takes seconds.
This can happen due to:
a payment being flagged as high-risk and someone has to manually review it
credit card requires extra protection, eg 3D Secure Authentication, which requires extra details from card holder to complete
These situations are handled by:
waiting for the PSP to send us a webhook when a payment is complete or polling its API if the PSP doesn't provide webhooks
showing a "pending" status to the user and giving them a page, where they can check-in for payment updates. We could also send them an email once their payment is complete
Communication among internal services
There are two types of communication patterns services use to communicate with one another - synchronous and asynchronous.
Synchronous communication (ie HTTP) works well for small-scale systems, but suffers as scale increases:
low performance - request-response cycle is long as more services get involved in the call chain
poor failure isolation - if PSPs or any other service fails, user will not receive a response
tight coupling - sender needs to know the receiver
hard to scale - not easy to support sudden increase in traffic due to not having a buffer
Asynchronous communication can be divided into two categories.
Single receiver - multiple receivers subscribe to the same topic and messages are processed only once:
Redrawn · diagram-design
Multiple receivers - multiple receivers subscribe to the same topic, but messages are forwarded to all of them:
Redrawn · diagram-design
Latter model works well for our payment system as a payment can trigger multiple side effects, handled by different services.
In a nutshell, synchronous communication is simpler but doesn't allow services to be autonomous.
Async communication trades simplicity and consistency for scalability and resilience.
Handling failed payments
Every payment system needs to address failed payments. Here are some of the mechanism we'll use to achieve that:
Tracking payment state - whenever a payment fails, we can determine whether to retry/refund based on the payment state.
Retry queue - payments which we'll retry are published to a retry queue
Dead-letter queue - payments which have terminally failed are pushed to a dead-letter queue, where the failed payment can be debugged and inspected.
Redrawn · diagram-design
Exactly-once delivery
We need to ensure a payment gets processed exactly-once to avoid double-charging a customer.
An operation is executed exactly-once if it is executed at-least-once and at-most-once at the same time.
To achieve the at-least-once guarantee, we'll use a retry mechanism:
Redrawn · diagram-design
Here are some common strategies on deciding the retry intervals:
immediate retry - client immediately sends another request after failure
fixed intervals - wait a fixed amount of time before retrying a payment
incremental intervals - incrementally increase retry interval between each retry
exponential back-off - double retry interval between subsequent retries
cancel - client cancels the request. This happens when the error is terminal or retry threshold is reached
As a rule of thumb, default to an exponential back-off retry strategy. A good practice is for the server to specify a retry interval using a Retry-After header.
An issue with retries is that the server can potentially process a payment twice:
client clicks the "pay button" twice, hence, they are charged twice
payment is successfully processed by PSP, but not by downstream services (ledger, wallet). Retry causes the payment to be processed by the PSP again
To address the double payment problem, we need to use an idempotency mechanism - a property that an operation applied multiple times is processed only once.
From an API perspective, clients can make multiple calls which produce the same result.
Idempotency is managed by a special header in the request (eg idempotency-key), which is typically a UUID.
Redrawn · diagram-design
Idempotency can be achieved using the database's mechanism of adding unique key constraints:
server attempts to insert a new row in the database
the insertion fails due to a unique key constraint violation
server detects that error and instead returns the existing object back to the client
Idempotency is also applied at the PSP side, using the nonce, which was previously discussed. PSPs will take care to not process payments with the same nonce twice.
Consistency
There are several stateful services called throughout a payment's lifecycle - PSP, ledger, wallet, payment service.
Communication between any two services can fail.
We can ensure eventual data consistency between all services by implementing exactly-once processing and reconciliation.
If we use replication, we'll have to deal with replication lag, which can lead to users observing inconsistent data between primary and replica databases.
To mitigate that, we can serve all reads and writes from the primary database and only utilize replicas for redundancy and fail-over.
Alternatively, we can ensure replicas are always in-sync by utilizing a consensus algorithm such as Paxos or Raft.
We could also use a consensus-based distributed database such as YugabyteDB or CockroachDB.
Payment security
Here are some mechanisms we can use to ensure payment security:
Request/response eavesdropping - we can use HTTPS to secure all communication
Data tampering - enforce encryption and integrity monitoring
Man-in-the-middle attacks - use SSL \w certificate pinning
Data loss - replicate data across multiple regions and take data snapshots
DDoS attack - implement rate limiting and firewall
Card theft - use tokens instead of storing real card information in our system
PCI compliance - a security standard for organizations which handle branded credit cards
Fraud - address verification, card verification value (CVV), user behavior analysis, etc
Step 4: Wrap Up
Other talking points:
Monitoring and alerting
Debugging tools - we need tools which make it easy to understand why a payment has failed
Currency exchange - important when designing a payment system for international use
Geography - different regions might have different payment methods
Cash payment - very common in places like India and Brazil
Google/Apple Pay integration
Chapter 27: Digital Wallet
Introduction
Payment platforms usually have a wallet service, where they allow clients to store funds within the application, which they can withdraw later.
You can also use it to pay for goods & services or transfer money to other users, who use the digital wallet service. That can be faster and cheaper than doing it via normal payment rails.
Redrawn · diagram-design
Step 1: Understand the Problem and Establish Design Scope
C: Should we only focus on transfers between digital wallets? Should we support any other operations?
I: Let's focus on transfers between digital wallets for now.
C: How many transactions per second does the system need to support?
I: Let's assume 1mil TPS
C: A digital wallet has strict correctness requirements. Can we assume transactional guarantees are sufficient?
I: Sounds good
C: Do we need to prove correctness?
I: We can do that via reconciliation, but that only detects discrepancies vs. showing us the root cause for them. Instead, we want to be able to replay data from the beginning to reconstruct the history.
C: Can we assume availability requirement is 99.99%?
I: Yes
C: Do we need to take foreign exchange into consideration?
I: No, it's out of scope
Here's what we have to support in summary:
Support balance transfers between two accounts
Support 1mil TPS
Reliability is 99.99%
Support transactions
Support reproducibility
Back-of-the-envelope estimation
A traditional relational database, provisioned in the cloud can support ~1000 TPS.
In order to reach 1mil TPS, we'd need 1000 database nodes. But if each transfer has two legs, then we actually need to support 2mil TPS.
One of our design goals would be to increase the TPS a single node can handle so that we can have less database nodes.
Per-node TPS
Node Number
100
20,000
1,000
2,000
10,000
200
Step 2: Propose High-Level Design and Get Buy-In
API Design
We only need to support one endpoint for this interview:
POST /v1/wallet/balance_transfer - transfers balance from one wallet to another
Request parameters - from_account, to_account, amount (string to not lose precision), currency, transaction_id (idempotency key).
Our wallet application maintains account balances for every user account.
One good data structure to represent this is a map<user_id, balance>, which can be implemented using an in-memory Redis store.
Since one redis node cannot withstand 1mil TPS, we need to partition our redis cluster into multiple nodes.
Example partitioning algorithm:
String accountID = "A";
Int partitionNumber = 7;
Int myPartition = accountID.hashCode() % partitionNumber;
Zookeeper can be used to store the number of partitions and addresses of redis nodes as it's a highly-available configuration storage.
Finally, a wallet service is a stateless service responsible for carrying out transfer operations. It can easily scale horizontally:
Redrawn · diagram-design
Although this solution addresses scalability concerns, it doesn't allow us to execute balance transfers atomically.
Distributed transactions
One approach for handling transactions is to use the two-phase commit protocol on top of standard, sharded relational databases:
Redrawn · diagram-design
Here's how the two-phase commit (2PC) protocol works:
Redrawn · diagram-design
Coordinator (wallet service) performs read and write operations on multiple databases as normal
When application is ready to commit the transaction, coordinator asks all databases to prepare it
If all databases replied with a "yes", then the coordinator asks the databases to commit the transaction.
Otherwise, all databases are asked to abort the transaction
Downsides to the 2PC approach:
Not performant due to lock contention
The coordinator is a single point of failure
Distributed transaction using Try-Confirm/Cancel (TC/C)
TC/C is a variation of the 2PC protocol, which works with compensating transactions:
Coordinator asks all databases to reserve resources for the transaction
Coordinator collects replies from DBs - if yes, DBs are asked to try-confirm. If no, DBs are asked to try-cancel.
One important difference between TC/C and 2PC is that 2PC performs a single transaction, whereas in TC/C, there are two independent transactions.
Here's how TC/C works in phases:
Phase
Operation
A
C
1
Try
Balance change: -$1
Do nothing
2
Confirm
Do nothing
Balance change: +$1
Cancel
Balance change: +$1
Do Nothing
Phase 1 - try:
Redrawn · diagram-design
coordinator starts local transaction in A's DB to reduce A's balance by 1$
C's DB is given a NOP instruction, which does nothing
Phase 2a - confirm:
Redrawn · diagram-design
if both DBs replied with "yes", confirm phase starts.
A's DB receives NOP, whereas C's DB is instructed to increase C's balance by 1$ (local transaction)
Phase 2b - cancel:
Redrawn · diagram-design
If any of the operations in phase 1 fails, the cancel phase starts.
A's DB is instructed to increase A's balance by 1$, C's DB receives NOP
Here's a comparison between 2PC and TC/C:
First Phase
Second Phase: success
Second Phase: fail
2PC
transactions are not done yet
Commit/Cancel all transactions
Cancel all transactions
TC/C
All transactions are completed - committed or canceled
Execute new transactions if needed
Reverse the already committed transaction
TC/C is also referred to as a distributed transaction by compensation. High-level operation is handled in the business logic.
Other properties of TC/C:
database agnostic, as long as database supports transactions
Details and complexity of distributed transactions need to be handled in the business logic
TC/C Failure modes
If the coordinator dies mid-flight, it needs to recover its intermediary state.
That can be done by maintaining phase status tables, atomically updated within the database shards:
Redrawn · diagram-design
What does that table contain:
ID and content of distributed transaction
status of try phase - not sent, has been sent, response received
second phase name - confirm or cancel
status of second phase
out-of-order flag (explained later)
One caveat when using TC/C is that there is a brief moment where the account states are inconsistent with each other while a distributed transaction is in-flight:
Redrawn · diagram-design
This is fine as long as we always recover from this state and that users cannot use the intermediary state to eg spend it.
This is guaranteed by always executing deductions prior to additions.
Try phase choices
Account A
Account C
Choice 1
-$1
NOP
Choice 2 (invalid)
NOP
+$1
Choice 3 (invalid)
-$1
+$1
Note that choice 3 from table above is invalid because we cannot guarantee atomic execution of transactions across different databases without relying on 2PC.
One edge-case to address is out of order execution:
Redrawn · diagram-design
It is possible that a database receives a cancel operation, before receiving a try. This edge case can be handled by adding an out of order flag in our phase status table.
When we receive a try operation, we first check if the out of order flag is set and if so, a failure is returned.
Distributed transaction using Saga
Another popular approach is using Sagas - a standard for implementing distributed transactions with microservice architectures.
Here's how it works:
all operations are ordered in a sequence. All operations are independent in their own databases.
operations are executed from first to last
when an operation fails, the entire process starts to roll back until the beginning with compensating operations
Redrawn · diagram-design
How do we coordinate the workflow? There are two approaches we can take:
Choreography - all services involved in a saga subscribe to the related events and do their part in the saga
Orchestration - a single coordinator instructs all services to do their jobs in the correct order
The challenge of using choreography is that business logic is split across multiple service, which communicate asynchronously.
The orchestration approach handles complexity well, so it is typically the preferred approach in a digital wallet system.
Here's a comparison between TC/C and Saga:
TC/C
Saga
Compensating action
In Cancel phase
In rollback phase
Central coordination
Yes
Yes (orchestration mode)
Operation execution order
any
linear
Parallel execution possibility
Yes
No (linear execution)
Could see the partial inconsistent status
Yes
Yes
Application or database logic
Application
Application
The main difference is that TC/C is parallelizable, so our decision is based on the latency requirement - if we need to achieve low latency, we should go for the TC/C approach.
Regardless of the approach we take, we still need to support auditing and replaying history to recover from failed states.
Event sourcing
In real-life, a digital wallet application might be audited and we have to answer certain questions:
Do we know the account balance at any given time?
How do we know the historical and current balances are correct?
How do we prove the system logic is correct after a code change?
Event sourcing is a technique which helps us answer these questions.
It consists of four concepts:
command - intended action from the real world, eg transfer 1$ from account A to B. Need to have a global order, due to which they're put into a FIFO queue.
commands, unlike events, can fail and have some randomness due to eg IO or invalid state.
commands can produce zero or more events
event generation can contain randomness such as external IO. This will be revisited later
event - historical facts about events which occured in the system, eg "transferred 1$ from A to B".
unlike commands, events are facts that have happened within our system
similar to commands, they need to be ordered, hence, they're enqueued in a FIFO queue
state - what has changed as a result of an event. Eg a key-value store between account and their balances.
state machine - drives the event sourcing process. It mainly validates commands and applies events to update the system state.
the state machine should be deterministic, hence, it shouldn't read external IO or rely on randomness.
Redrawn · diagram-design
Here's a dynamic view of event sourcing:
Redrawn · diagram-design
For our wallet service, the commands are balance transfer requests. We can put them in a FIFO queue, such as Kafka:
Redrawn · diagram-design
Here's the full picture:
Redrawn · diagram-design
state machine reads commands from the command queue
balance state is read from the database
command is validated. If valid, two events for each of the accounts is generated
next event is read and applied by updating the balance (state) in the database
The main advantage of using event sourcing is its reproducibility. In this design, all state update operations are saved as immutable history of all balance changes.
Historical balances can always be reconstructed by replaying events from the beginning.
Because the event list is immutable and the state machine is deterministic, we are guaranteed to succeed in replaying any of the intermediary states.
Redrawn · diagram-design
All audit-related questions asked in the beginning of the section can be addressed by relying on event sourcing:
Do we know the account balance at any given time? - events can be replayed from the start until the point which we are interested in
How do we know the historical and current balances are correct? - correctness can be verified by recalculating all events from the start
How do we prove the system logic is correct after a code change? - we can run different versions of the code against the events and verify their results are identical
Answering client queries about their balance can be addressed using the CQRS architecture - there can be multiple read-only state machines which are responsible for querying the historical state, based on the immutable events list:
Redrawn · diagram-design
Step 3: Design Deep Dive
In this section we'll explore some performance optimizations as we're still required to scale to 1mil TPS.
High-performance event sourcing
The first optimization we'll explore is to save commands and events into local disk store instead of an external store such as Kafka.
This avoids the network latency and also, since we're only doing appends, that operation is generally fast for HDDs.
The next optimization is to cache recent commands and events in-memory in order to save the time of loading them back from disk.
At a low-level, we can achieve the aforementioned optimizations by leveraging a command called mmap, which stores data in local disk as well as cache it in-memory:
Redrawn · diagram-design
The next optimization we can do is also store state in the local file system using SQLite - a file-based local relational database. RocksDB is also another good option.
For our purposes, we'll choose RocksDB because it uses a log-structured merge-tree (LSM), which is optimized for write operations.
Read performance is optimized via caching.
Redrawn · diagram-design
To optimize the reproducibility, we can periodically save snapshots to disk so that we don't have to reproduce a given state from the very beginning every time. We could store snapshots as large binary files in distributed file storage, eg HDFS:
Redrawn · diagram-design
Reliable high-performance event sourcing
All the optimizations done so far are great, but they make our service stateful. We need to introduce some form of replication for reliability purposes.
Before we do that, we should analyze what kind of data needs high reliability in our system:
state and snapshot can always be regenerated by reproducing them from the events list. Hence, we only need to guarantee the event list reliability.
one might think we can always regenerate the events list from the command list, but that is not true, since commands are non-deterministic.
conclusion is that we need to ensure high reliability for the events list only
In order to achieve high reliability for events, we need to replicate the list across multiple nodes. We need to guarantee:
that there is no data loss
the relative order of data within a log file remains the same across replicas
To achieve this, we can employ a consensus algorithm, such as Raft.
With Raft, there is a leader who is active and there are followers who are passive. If a leader dies, one of the followers picks up.
As long as more than half of the nodes are up, the system continues running.
Redrawn · diagram-design
With this approach, all nodes update the state, based on the events list. Raft ensures leader and followers have the same events list.
Distributed event sourcing
So far, we've managed to design a system which has high single-node performance and is reliable.
Some limitations we have to tackle:
The capacity of a single raft group is limited. At some point, we need to shard the data and implement distributed transactions
In the CQRS architecture, the request/response flow is slow. A client would need to periodically poll the system to learn when their wallet has been updated
Polling is not real-time, hence, it can take a while for a user to learn about an update in their balance. Also, it can overload the query services if the polling frequency is too high:
Redrawn · diagram-design
To mitigate the system load, we can introduce a reverse proxy, which sends commands on behalf of the user and polls for response on their behalf:
Redrawn · diagram-design
This alleviates the system load as we could fetch data for multiple users using a single request, but it still doesn't solve the real-time receipt requirement.
One final change we could do is make the read-only state machines push responses back to the reverse proxy once it's available. This can give the user the sense that updates happen real-time:
Redrawn · diagram-design
Finally, to scale the system even further, we can shard the system into multiple raft groups, where we implement distributed transactions on top of them using an orchestrator either via TC/C or Sagas:
Redrawn · diagram-design
Here's an example lifecycle of a balance transfer request in our final system:
User A sends a distributed transaction to the Saga coordinator with two operations - A-1 and C+1.
Saga coordinator creates a record in the phase status table to trace the status of the transaction
Coordinator determines which partitions it needs to send commands to.
Partition 1's raft leader receives the A-1 command, validates it, converts it to an event and replicates it across other nodes in the raft group
Event result is synchronized to the read state machine, which pushes a response back to the coordinator
Coordinator creates a record indicating that the operation was successful and proceeds with the next operation - C+1
Next operation is executed similarly to the first one - partition is determined, command is sent, executed, read state machine pushes back a response
Coordinator creates a record indicating operation 2 was also successful and finally informs the client of the result
Step 4: Wrap Up
Here's the evolution of our design:
We started from a solution using an in-memory Redis. The problem with this approach is that it is not durable storage.
We moved on to using relational databases, on top of which we execute distributed transactions using 2PC, TC/C or distributed saga.
Next, we introduced event sourcing in order to make all the operations auditable
We started by storing the data into external storage using external database and queue, but that's not performant
We proceeded to store data in local file storage, leveraging the performance of append-only operations. We also used caching to optimize the read path
The previous approach, although performant, wasn't durable. Hence, we introduced Raft consensus with replication to avoid single points of failure
We also adopted CQRS with a reverse proxy to manage a transaction's lifecycle on behalf of our users
Finally, we partitioned our data across multiple raft groups, which are orchestrated using a distributed transaction mechanism - TC/C or distributed saga
Chapter 28: Stock Exchange
Introduction
We'll design an electronic stock exchange in this chapter.
Its basic function is to efficiently match buyers and sellers.
Major stock exchanges are NYSE, NASDAQ, among others.
Redrawn · diagram-design
Step 1: Understand the Problem and Establish Design scope
C: Which securities are we going to trade? Stocks, options or futures?
I: Only stocks for simplicity
C: Which order types are supported - place, cancel, replace? What about limit, market, conditional orders?
I: We need to support placing and canceling an order. We need to only consider limit orders for the order type.
C: Does the system need to support after hours trading?
I: No, just normal trading hours
C: Could you describe the exchange's basic functions?
I: Clients can place or cancel limit orders and receive matched trades in real-time. They should be able to see the order book in real time.
C: What's the scale of the exchange?
I: Tens of thousands of users trading at the same time and ~100 symbols. Billions of orders per day. We need to also support risk checks for compliance.
C: What kind of risk checks?
I: Let's do simple risk checks - eg limiting a user to trade only 1mil apple stocks in a day
C: How about user wallet engagement?
I: We need to ensure clients have sufficient funds before placing orders. Funds meant for pending orders need to be withheld until order is finalized.
Non-functional requirements
The scale mentioned by the interviewer hints that we are to design a small to medium scale exchange.
We need to also ensure flexibility to support more symbols and users in the future.
Other non-functional requirements:
Availability - At least 99.99%. Downtime can harm reputation
Fault tolerance - fault tolerance and a fast recovery mechanism are needed to limit the impact of a production incident
Latency - Round-trip latency should be in the ms level with focus on 99th percentile. Persistently high 99p latency causes bad experience for a handful or users.
Security - We should have an account management system. For legal compliance, we need to support KYC to verify user identity. We should also protect against DDoS for public resources.
Back-of-the-envelope estimation
100 symbols, 1bil orders per day
Normal trading hours are from 09:30 to 16:00 (6.5h)
QPS = 1bil / 6.5 / 3600 = 43000
Peak QPS = 5*QPS = 215000
Trading volume is significantly higher when the market opens
Step 2: Propose High-Level Design and Get Buy-In
Business Knowledge 101
Let's discuss some basic concepts, related to an exchange.
A broker mediates interactions between an exchange and end users - Robinhood, Fidelity, etc.
Institutional clients trade in large quantities using specialized trading software. They need specialized treatment.
Eg order splitting when trading in large volumes to avoid impacting the market.
Types of orders:
Limit - buy or sell at a fixed price. It might not find a match immediately or it might be partially matched.
Market - doesn't specify a price. Executed at the current market price immediately.
Prices:
Bid - highest price a buyer is willing to buy a stock
Ask - lowest price a seller is willing to sell a stock
The US market has three tiers of price quotes - L1, L2, L3.
L1 market data contains best bid/ask prices and quantities:
Redrawn · diagram-design
L2 includes more price levels:
Redrawn · diagram-design
L3 shows levels and queued quantity at each level:
Redrawn · diagram-design
A candlestick shows the market open and close price, as well as the highest and lowest prices in the given interval:
Redrawn · diagram-design
FIX is a protocol for exchanging securities transaction information, used by most vendors. Example securities transaction:
Order enters exchange through client gateway, which validates, rate limits, authenticates, etc. Order is forwarded to order manager.
Order manager performs risk checks based on rules set by the risk manager
After passing risk checks, order manager verifies there are sufficient funds in the wallet for the order
Order is sent to matching engine. When match is found, matching engine emits two executions (called fills) for buy and sell. Both orders are sequenced so that they're deterministic.
Executions are returned to the client.
Market data flow (M1-M3):
matching engine generates a stream of executions, sent to the market data publisher
Market data publisher constructs the candlestick charts and sends them to the data service
Market data is stored in specialized storage for real-time analytics. Brokers connect to the data service for timely market data.
Reporter flow (R1-R2):
reporter collects all necessary reporting fields from orders and executions and writes them to DB
Trading flow is on the critical path, whereas the rest of the flows are not, hence, latency requirements differ between them.
Trading flow
The trading flow is on the critical path, hence, it should be highly optimized for low latency.
The matching engine is at its heart, also called the cross engine. Primary responsibilities:
Maintain the order book for each symbol - a list of buy/sell orders for a symbol.
Match buy and sell orders - a match results in two executions (fills), with one each for the buy and sell sides. This function must be fast and accurate
Distribute the execution stream as market data
Matches must be produced in a deterministic order. Foundational for high availability
Next is the sequencer - it is the key component making the matching engine deterministic by stamping each inbound order and outbound fill with a sequence ID.
Redrawn · diagram-design
We stamp inbound orders and outbound fills for several reasons:
timeliness and fairness
fast recovery/replay
exactly-once guarantee
Conceptually, we could use Kafka as our sequencer since it's effectively an inbound and outbound message queue. However, we're going to implement it ourselves in order to achieve lower latency.
The order manager manages the orders state. It also interacts with the matching engine - sending orders and receiving fills.
The order manager's responsibilities:
Sends orders for risk checks - eg verifying user's trade volume is less than 1mil
Checks the order against the user wallet and verifies there are sufficient funds to execute it
It sends the order to the sequencer and on to the matching engine. To reduce bandwidth, only necessary order information is passed to the matching engine
Executions (fills) are received back from the sequencer, where they are then send to the brokers via the client gateway
The main challenge with implementing the order manager is the state transition management. Event sourcing is one viable solution (discussed in deep dive).
Finally, the client gateway receives orders from users and sends them to the order manager. Its responsibilities:
Redrawn · diagram-design
Since the client gateway is on the critical path, it should stay lightweight.
There can be multiple client gateways for different clients. Eg a colo engine is a trading engine server, rented by the broker in the exchange's data center:
Redrawn · diagram-design
Market data flow
The market data publisher receives executions from the matching engine and builds the order book/candlestick charts from the execution stream.
That data is sent to the data service, which is responsible for showing the aggregated data to subscribers:
Redrawn · diagram-design
Reporting flow
The reporter is not on the critical path, but it is an important component nevertheless.
Redrawn · diagram-design
It is responsible for trading history, tax reporting, compliance reporting, settlements, etc.
Latency is not a critical requirement for the reporting flow. Accuracy and compliance are more important.
API Design
Clients interact with the stock exchange via the brokers to place orders, view executions, market data, download historical data for analysis, etc.
We use a RESTful API for communication between the client gateway and the brokers.
For institutional clients, a proprietary protocol is used to satisfy their low-latency requirements.
Create order:
POST /v1/order
Parameters:
symbol - the stock symbol. String
side - buy or sell. String
price - the price of the limit order. Long
orderType - limit or market (we only support limit orders in our design). String
quantity - the quantity of the order. Long
Response:
id - the ID of the order. Long
creationTime - the system creation time of the order. Long
filledQuantity - the quantity that has been successfully executed. Long
remainingQuantity - the quantity still to be executed. Long
status - new/canceled/filled. String
rest of the attributes are the same as the input parameters
Get execution:
GET /execution?symbol={:symbol}&orderId={:orderId}&startTime={:startTime}&endTime={:endTime}
Parameters:
symbol - the stock symbol. String
orderId - the ID of the order. Optional. String
startTime - query start time in epoch [11]. Long
endTime - query end time in epoch. Long
Response:
executions - array with each execution in scope (see attributes below). Array
id - the ID of the execution. Long
orderId - the ID of the order. Long
symbol - the stock symbol. String
side - buy or sell. String
price - the price of the execution. Long
orderType - limit or market. String
quantity - the filled quantity. Long
Get order book:
GET /marketdata/orderBook/L2?symbol={:symbol}&depth={:depth}
Parameters:
symbol - the stock symbol. String
depth - order book depth per side. Int
Response:
bids - array with price and size. Array
asks - array with price and size. Array
get candlesticks:
GET /marketdata/candles?symbol={:symbol}&resolution={:resolution}&startTime={:startTime}&endTime={:endTime}
Parameters:
symbol - the stock symbol. String
resolution - window length of the candlestick chart in seconds. Long
startTime - start time of the window in epoch. Long
endTime - end time of the window in epoch. Long
Response:
candles - array with each candlestick data (attributes listed below). Array
open - open price of each candlestick. Double
close - close price of each candlestick. Double
high - high price of each candlestick. Double
low - low price of each candlestick. Double
Data models
There are three main types of data in our exchange:
Product, order, execution
order book
candlestick chart
Product, order, execution
Products describe the attributes of a traded symbol - product type, trading symbol, UI display symbol, etc.
This data doesn't change frequently, it is primarily used for rendering in a UI.
An order represents an instruction for a buy/sell order. Executions are outbound matched result.
Here's the data model:
Redrawn · diagram-design
We encounter orders and executions in all of our three flows:
in the critical path, they are processed in-memory for high performance. They are stored and recovered from the sequencer.
The reporter writes orders and executions to the database for reporting use-cases
Executions are forwarded to market data to reconstruct the order book and candlestick chart
Order book
The order book is a list of buy/sell orders for an instrument, organized by price level.
An efficient data structure for this model, needs to satisfy:
constant lookup time - getting volume at price level or between price levels
fast add/execute/cancel operations
query best bid/ask price
iterate through price levels
Example order book execution:
Redrawn · diagram-design
After fulfilling this large order, the price increases as the bid/ask spread widens.
Example order book implementation in pseudo code:
class PriceLevel{
    private Price limitPrice;
    private long totalVolume;
    private List<Order> orders;
}

class Book<Side> {
    private Side side;
    private Map<Price, PriceLevel> limitMap;
}

class OrderBook {
    private Book<Buy> buyBook;
    private Book<Sell> sellBook;
    private PriceLevel bestBid;
    private PriceLevel bestOffer;
    private Map<OrderID, Order> orderMap;
}
For a more efficient implementation, we can use a doubly-linked list instead of a standard list:
Placing a new order is O(1), because we're adding an order to the tail of the list.
Matching an order is O(1), because we are deleting an order from the head
Canceling an order means deleting an order from the order book. We utilize orderMap for O(1) lookup and O(1) delete (due to the Order having a reference to the previous element in the list).
Redrawn · diagram-design
This data structure is also used in the market data services to reconstruct the order book.
Candlestick chart
The candlestick data is calcualated within the market data services based on processing orders in a time interval:
class Candlestick {
    private long openPrice;
    private long closePrice;
    private long highPrice;
    private long lowPrice;
    private long volume;
    private long timestamp;
    private int interval;
}

class CandlestickChart {
    private LinkedList<Candlestick> sticks;
}
Some optimizations to avoid consuming too much memory:
Use pre-allocated ring buffers to hold sticks to reduce the allocation number
Limit the number of sticks in memory and persist the rest to disk
We'll use an in-memory columnar database (eg KDB) for real-time analytics. After market close, data is persisted in historical database.
Step 3: Design Deep Dive
One interesting thing to be aware of about modern exchanges is that unlike most other software, they typically run everything on one gigantic server.
Let's explore the details.
Performance
For an exchange, it is very important to have good overall latency for all percentiles.
How can we reduce latency?
Reduce the number of tasks on the critical path
Shorten the time spent on each task by reducing network/disk usage and/or reducing task execution time
To achieve the first goal, we're stripped the critical path from all extraneous responsibility, even logging is removed to achieve optimal latency.
If we follow the original design, there are several bottlenecks - network latency between services and disk usage of the sequencer.
With such a design we can achieve tens of milliseconds end to end latency. We want to achieve tens of microseconds instead.
Hence, we'll put everything on one server and processes are going to communicate via mmap as an event store:
Redrawn · diagram-design
Another optimization is using an application loop (while loop executing mission-critical tasks), pinned to the same CPU to avoid context switching:
Redrawn · diagram-design
Another side effect of using an application loop is that there is no lock contention - multiple threads fighting for the same resource.
Let's now explore how mmap works - it is a UNIX syscall, which maps a file on disk to an application's memory.
One trick we can use is creating the file in /dev/shm, which stands for "shared memory". Hence, we have no disk access at all.
Event sourcing
Event sourcing is discussed in-depth in the digital wallet chapter. Reference it for all the details.
In a nutshell, instead of storing current states, we store immutable state transitions:
Redrawn · diagram-design
On the left - traditional schema
On the right - event source schema
Here's how our design looks like thus far:
Redrawn · diagram-design
external domain interacts with our client gateway using the FIX protocol
Order manager receives the new order event, validates it and adds it to its internal state. Order is then sent to matching core
If order is matched, the OrderFilledEvent is generated and sent over mmap
Other components subscribe to the event store and do their part of the processing
One additional optimizations - all components hold a copy of the order manager, which is packaged as a library to avoid extra calls for managing orders
The sequencer in this design, changes to not be an event store, but be a single writer, sequencing events before forwarding them to the event store:
Redrawn · diagram-design
High availability
We aim for 99.99% availability - only 8.64s of downtime per day.
To achieve that, we have to identify single-point-of-failures in the exchange architecture:
setup backup instances of critical services (eg matching engine) which are on stand-by
aggressively automate failure detection and failover to the backup instance
Stateless services such as the client gateway can easily be horizontally scaled by adding more servers.
For stateful components, we can process inbound events, but not publish outbound events if we're not the leader:
Redrawn · diagram-design
To detect the primary replica being down, we can send heartbeats to detect that its non-functional.
This mechanism only works within the boundary of a single server.
If we want to extend it, we can setup an entire server as hot/warm replica and failover in case of failure.
To replicate the event store across the replicas, we can use reliable UDP for faster communication.
Fault tolerance
What if even the warm instances go down? It is a low probability event but we should be ready for it.
Large tech companies tackle this problem by replicating core data to data centers in multiple cities to mitigate eg natural disasters.
Questions to consider:
If the primary instance is down, how and when do we failover to the backup instance?
How do we choose the leader among the backup instances?
What is the recovery time needed (RTO - recovery time objective)?
What functionalities need to be recovered? Can our system operate under degraded conditions?
How to address these:
System can be down due to a bug (affecting primary and replicas), we can use chaos engineering to surface edge-cases and disastrous outcomes like these
Initially though, we could perform failovers manually until we gather sufficient knowledge about the system's failure modes
leader-election can be used (eg Raft) to determine which replica becomes the leader in the event of the primary going down
Example of how replication works across different servers:
Finally, we need to also consider loss tolerance - how much data can we lose before things get critical?
This will determine how often we backup our data.
For a stock exchange, data loss is unacceptable, so we have to backup data often and rely on raft's replication to reduce probability of data loss.
Matching algorithms
Slight detour on how matching works via pseudo code:
This matching algorithm uses the FIFO algorithm for determining which orders at a price level to match.
Determinism
Functional determinism is guaranteed via the sequencer technique we used.
The actual time when the event happens doesn't matter:
Redrawn · diagram-design
Latency determinism is something we have to track. We can calculate it based on monitoring 99 or 99.99 percentile latency.
Things which can cause latency spikes are garbage collector events in eg Java.
Market data publisher optimizations
The market data publisher receives matched results from the matching engine and rebuilds the order book and candlestick charts based on them.
We only keep part of the candlesticks as we don't have infinite memory. Clients can choose how much granular info they want. More granular info might require a higher price:
Redrawn · diagram-design
A ring buffer (aka circular buffer) is a fixed-size queue with the head connected to the tail. The space is preallocated to avoid allocations. The data structure is also lock-free.
Another technique to optimize the ring buffer is padding, which ensures the sequence number is never in a cache line with anything else.
Distribution fairness of market data and multicast
We need to ensure subscribers receive the data at the same time since if one receives data before another, that gives them crucial market insight, which they can use to manipulate the market.
To achieve this, we can use multicast using reliable UDP when publishing data to subscribers.
Data can be transported via the internet in three ways:
Unicast - one source, one destination
Broadcast - one source to entire subnetwork
Multicast - one source to a set of hosts on different subnetworks
In theory, by using multicast, all subscribers should receive the data at the same time.
UDP, however, is unreliable and the data might not reach everyone. It can be enhanced with retransmissions, however.
Colocation
Exchanges offer brokers the ability to colocate their servers in the same data center as the exchange.
This reduces the latency drastically and can be considered a VIP service.
Network Security
DDoS is a challenge for exchanges as there are some internet-facing services. Here's our options:
Isolate public services and data from private services, so DDoS attacks don't impact the most important clients
Use a caching layer to store data which is infrequently updated
Harden URLs against DDoS, eg prefer https://my.website.com/data/recent vs. https://my.website.com/data?from=123&to=456, because the former is more cacheable
Effective allowlist/blocklist mechanism is needed.
Rate limiting can be used to mitigate DDoS
Step 4: Wrap Up
Other interesting notes:
not all exchanges rely on putting everything on one big server, but some still do
modern exchanges rely more on cloud infrastructure and also on automatic market makers (AMM) to avoid maintaining an order book